
Definition
GE-McKinsey nine-box matrix is a strategy tool that offers a systematic approach for the multi-business corporation to prioritize its investments among its business units.[1]
GE-McKinsey is a framework that evaluates business portfolio, provides further strategic implications and helps to prioritize the investment needed for each business unit (BU).[2]
What is GE McKinsey Matrix
In the business world, much like anywhere else, the problem of resource scarcity is affecting the decisions the companies make. With limited resources, but many opportunities to use them, businesses need to choose how to use their cash best.
The fight for investments takes place at every level of the company: between teams, functional departments, divisions or business units. The question of where and how much to invest is an ever-going headache for those who allocate the resources.
How does this affect the diversified businesses? Multi-business companies manage complex business portfolios, often, with as many as 50, 60 or 100 products and services. The products or business units differ in what they do, how well they perform, or what their future prospects are.
This makes it very hard to make a decision on which products the company should invest. At least, it was hard until the BCG matrix and its improved version, the GE-McKinsey matrix came to help. These tools solved the problem by comparing the business units and assigning them to the groups that are worth investing in or the groups that should be harvested or divested.
In the 1970s, General Electric was managing a huge and complex portfolio of unrelated products and was unsatisfied with the returns from its investments in the products. At the time, companies usually relied on projections of future cash flows, future market growth or some other future projections to make investment decisions, which was an unreliable method to allocate resources.
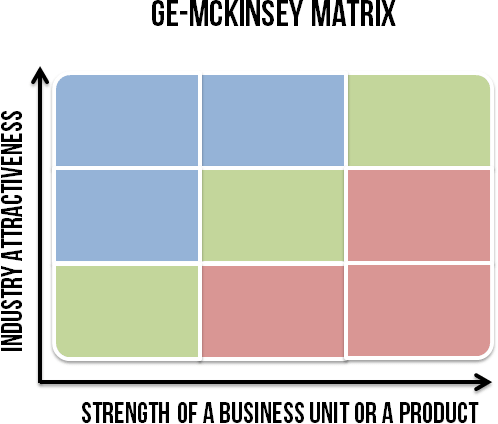
Therefore, GE consulted McKinsey & Company and as a result the nine-box framework was designed. The nine-box matrix plots the BUs on its 9 cells that indicate whether the company should invest in a product, harvest/divest it or do further research on the product and invest in it if there are still some resources left. The BUs are evaluated on two axes: industry attractiveness and the competitive strength of a unit.
Industry Attractiveness
Industry attractiveness indicates how hard or easy it will be for a company to compete in the market and earn profits. The more profitable the industry is, the more attractive it becomes. When evaluating the industry attractiveness, analysts should look at how an industry will change in the long run rather than in the near future, because the investments needed for the product usually require long-lasting commitment.
Industry attractiveness consists of many factors that collectively determine the competition level in it. There’s no definite list of which factors should be included to determine industry attractiveness, but the following are the most common: [1]
- Long-run growth rate
- Industry size
- Industry profitability: entry barriers, exit barriers, supplier power, buyer power, threat of substitutes and available complements (use Porter’s Five Forces analysis to determine this)
- Industry structure (use Structure-Conduct-Performance framework to determine this)
- Product life cycle changes
- Changes in demand
- Trend of prices
- Macro environment factors (use PEST or PESTEL for this)
- Seasonality
- Availability of labor
- Market segmentation
Competitive strength of a business unit or a product
Along the X axis, the matrix measures how strong, in terms of competition, a particular business unit is against its rivals. In other words, managers try to determine whether a business unit has a sustainable competitive advantage (or at least a temporary competitive advantage) or not. If the company has a sustainable competitive advantage, the next question is: “For how long will it be sustained?”
The following factors determine the competitive strength of a business unit:
- Total market share
- Market share growth compared to rivals
- Brand strength (use brand value for this)
- Profitability of the company
- Customer loyalty
- VRIO resources or capabilities (use VRIO framework to determine this)
- Your business unit strength in meeting industry’s critical success factors (use Competitive Profile Matrix to determine this)
- Strength of a value chain (use Value Chain Analysis and Benchmarking to determine this)
- Level of product differentiation
- Production flexibility
Advantages
- Helps to prioritize the limited resources in order to achieve the best returns.
- Managers become more aware of how their products or business units perform.
- It’s more sophisticated business portfolio framework than the BCG matrix.
- Identifies the strategic steps the company needs to make to improve the performance of its business portfolio.
Disadvantages
- Requires a consultant or a highly experienced person to determine industry’s attractiveness and business unit strength as accurately as possible.
- It is costly to conduct.
- It doesn’t take into account the synergies that could exist between two or more business units.
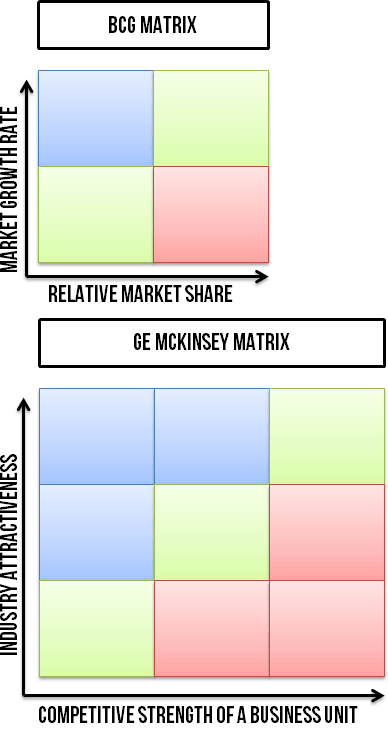
Difference between GE McKinsey and BCG matrices
GE McKinsey matrix is a very similar portfolio evaluation framework to the BCG matrix. Both matrices are used to analyze a company’s product or business unit portfolio and facilitate investment decisions.
The main differences:
- Visual difference. BCG is only a four-cell matrix, while GE McKinsey is a nine-cell matrix. Nine cells provide a better visual portrait of where business units stand in the matrix. It also separates the invest/grow cells from harvest/divest cells that are much closer to each other in the BCG matrix and may confuse others aboutas developed is that BC what investment decisions to make.

- Comprehensiveness. The reason why the GE McKinsey framework was developed is that the BCG portfolio tool wasn’t sophisticated enough for the guys from General Electric. In the BCG matrix, the competitive strength of a business unit is equal to the relative market share, which assumes that the larger the market share a business has the better it is positioned to compete in the market. This is true, but it’s too simplistic to assume that it’s the only factor affecting the competition in the market. The same is true with industry attractiveness that is measured only as the market growth rate in BCG. It comes as no surprise that GE, with its complex business portfolio, needed something more comprehensive than that.
Using the tool
There are no established processes or models that managers could use when performing the analysis. Therefore, we designed the following steps to facilitate the process:
Step 1. Determine industry attractiveness of each business unit
- Make a list of factors. The first thing you’ll need to do is to identify, which factors to include when measuring industry attractiveness. We’ve provided the list of the most common factors, but you should include the factors that are the most appropriate to your industries.
- Assign weights. Weights indicate how important a factor is to industry’s attractiveness. A number from 0.01 (not important) to 1.0 (very important) should be assigned to each factor. The sum of all weights should equal to 1.0.
- Rate the factors. The next thing you need to do is to rate each factor for each of your products or business units. Choose the values between ‘1-5’ or ‘1-10’, where ‘1’ indicates the low industry attractiveness and ‘5’ or ‘10’ high industry attractiveness.
- Calculate the total scores. Total score is the sum of all weighted scores for each business unit. Weighted scores are calculated by multiplying weights and ratings. Total scores allow for a comparison of industry attractiveness for each business unit.
Industry Attractiveness (1/2)
| Business Unit 1 | Business Unit 2 | ||||
| Factor | Weight | Rating | Weighted Score | Rating | Weighted Score |
|---|---|---|---|---|---|
| Industry growth rate | 0.25 | 3 | 0.75 | 4 | 1 |
| Industry size | 0.22 | 3 | 0.66 | 3 | 0.66 |
| Industry profitability | 0.18 | 5 | 0.90 | 1 | 0.18 |
| Industry structure | 0.17 | 4 | 0.68 | 4 | 0.68 |
| Trend of prices | 0.09 | 3 | 0.27 | 3 | 0.27 |
| Market segmentation | 0.09 | 1 | 0.09 | 3 | 0.27 |
| Total score | 1.00 | – | 3.35 | – | 3.06 |
Industry Attractiveness (2/2)
| Business Unit 3 | Business Unit 4 | ||||
| Factor | Weight | Rating | Weighted Score | Rating | Weighted Score |
|---|---|---|---|---|---|
| Industry growth rate | 0.25 | 3 | 0.75 | 2 | 0.50 |
| Industry size | 0.22 | 2 | 0.44 | 5 | 1.10 |
| Industry profitability | 0.18 | 1 | 0.18 | 5 | 0.90 |
| Industry structure | 0.17 | 2 | 0.34 | 4 | 0.68 |
| Trend of prices | 0.09 | 2 | 0.18 | 3 | 0.27 |
| Market segmentation | 0.09 | 2 | 0.18 | 3 | 0.27 |
| Total score | 1.00 | – | 2.07 | – | 3.72 |
This is a tough task and one that usually requires involving a consultant who is an expert in the industries in question. The consultant will help you to determine the weights and to rate them properly so the analysis is as accurate as possible.
Step 2. Determine the competitive strength of each business unit
‘Step 2’ is the same as ‘Step 1’ only this time, instead of industry attractiveness, the competitive strength of a business unit is evaluated.
- Make a list of factors. Choose the competitive strength factors from our list or add your own factors.
- Assign weights. Weights indicate how important a factor is in achieving sustainable competitive advantage. A number from 0.01 (not important) to 1.0 (very important) should be assigned to each factor. The sum of all weights should equal to 1.0.
- Rate the factors. Rate each factor for each of your product or business units. Choose the values between ‘1-5’ or ‘1-10’, where ‘1’ indicates the weak strength and ‘5’ or ‘10’ powerful strength.
- Calculate the total scores. See ‘Step 1’.
Competitive Strength (1/2)
| Business Unit 1 | Business Unit 2 | ||||
| Factor | Weight | Rating | Weighted Score | Rating | Weighted Score |
|---|---|---|---|---|---|
| Market share | 0.22 | 2 | 0.44 | 2 | 0.44 |
| Relative growth rate | 0.18 | 3 | 0.48 | 2 | 0.38 |
| Company’s profitability | 0.14 | 3 | 0.42 | 1 | 0.14 |
| Brand value | 0.10 | 1 | 0.10 | 2 | 0.20 |
| VRIO resources | 0.20 | 1 | 0.20 | 4 | 0.80 |
| CPM Score | 0.16 | 2 | 0.32 | 5 | 0.80 |
| Total score | 1.00 | – | 1.96 | – | 2.74 |
Competitive Strength (2/2)
| Business Unit 3 | Business Unit 4 | ||||
| Factor | Weight | Rating | Weighted Score | Rating | Weighted Score |
|---|---|---|---|---|---|
| Market share | 0.22 | 4 | 0.88 | 4 | 0.88 |
| Relative growth rate | 0.18 | 4 | 0.64 | 2 | 0.36 |
| Company’s profitability | 0.14 | 3 | 0.42 | 3 | 0.42 |
| Brand value | 0.10 | 3 | 0.30 | 3 | 0.30 |
| VRIO resources | 0.20 | 4 | 0.80 | 4 | 0.80 |
| CPM Score | 0.16 | 5 | 0.80 | 5 | 0.80 |
| Total score | 1.00 | – | 3.92 | – | 3.56 |
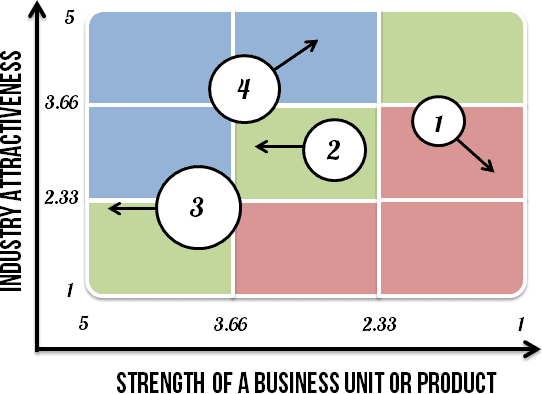
Step 3. Plot the business units on a matrix
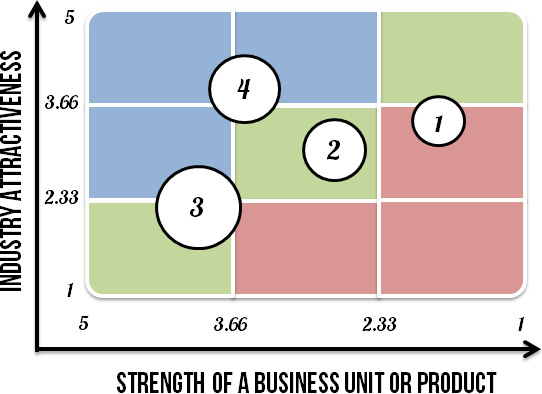
With all the evaluations and scores in place, we can plot the business units on the matrix. Each business unit is represented as a circle. The size of the circle should correspond to the proportion of the business revenue generated by that business unit.
For example, ‘Business unit 1’ generates 20% of the revenue and ‘Business unit 2’ generates 40%of the revenue for the company. The size of a circle for ‘Business unit 1’ will be half the size of a circle for ‘Business unit 2’.
Step 4. Analyze the information
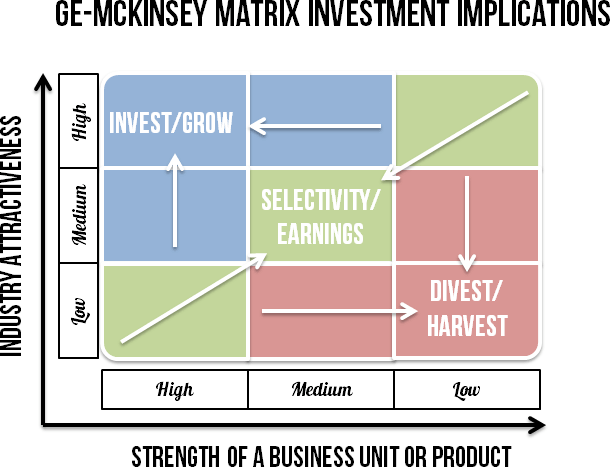
There are different investment implications you should follow, depending on which boxes your business units have been plotted. There are 3 groups of boxes: investment/grow, selectivity/earnings and harvest/divest boxes. Each group of boxes indicates what you should do with your investments.
Investment implications
| Box | Invest/Grow | Selectivity/Earnings | Harvest/Divest |
|---|---|---|---|
| Invest or not? | Definitely invest | Invest if there’s money left and the situation of business unit could be improved | Invest just enough to keep the business unit operating or divest |
Invest/Grow box. Companies should invest into the business units that fall into these boxes as they promise the highest returns in the future. These business units will require a lot of cash because they’ll be operating in growing industries and will have to maintain or grow their market share.
It is essential to provide as much resources as possible for BUs so there would be no constraints for them to grow. The investments should be provided for R&D, advertising, acquisitions and to increase the production capacity to meet the demand in the future.
Selectivity/Earnings box. You should invest into these BUs only if you have the money left over the investments in invest/grow business units group and if you believe that BUs will generate cash in the future.
These business units are often considered last as there’s a lot of uncertainty with them. The general rule should be to invest in business units that operate in huge markets and there are not many dominant players in the market, so the investments would help to easily win larger market share.
Harvest/Divest box. The business units that are operating in unattractive industries, don’t have sustainable competitive advantages or are incapable of achieving it and are performing relatively poorly fall into harvest/divest boxes. What should companies do with these business units?
First, if the business unit generates surplus cash, companies should treat them the same as the business units that fall into the ‘cash cows’ box in the BCG matrix. This means that the companies should invest into these business units just enough to keep them operating and collect all the cash generated by it. In other words, it’s worth to invest into such a business as long as investments into it doesn’t exceed the cash generated from it.
Second, the business units that only make losses should be divested. If that’s impossible and there’s no way to turn the losses into profits, the company should liquidate the business unit.
Step 5. Identify the future direction of each business unit
The GE McKinsey matrix only provides the current picture of industry attractiveness and the competitive strength of a business unit and doesn’t consider how they may change in the future.
Further analysis may reveal that investments into some of the business units can considerably improve their competitive positions or that the industry may experience major growth in the future. This affects the decisions we make about our investments into one or another business unit.
For example, our previous evaluations show that the ‘Business Unit 1’ belongs to invest/grow box, but further analysis of an industry reveals that it’s going to shrink substantially in the near future.
Therefore, in the near future, the business unit will be in the harvest/divest group rather than invest/grow box. Would you still invest as much in ‘Business Unit 1’ as you would have invested initially? The answer is no and the matrix should take that into consideration.
How to do that? Well, the company should consult with the industry analysts to determine whether the industry attractiveness will grow, stay the same or decrease in the future. You should also discuss with your managers whether your business unit’s competitive strength will likely increase or decrease in the near future.
When all the information is collected you should include it to your existing matrix, by adding the arrows to the circles. The arrows should point to the future position of a business unit.
The following table shows how industry attractiveness and business unit competitive strength will change in 2 years.
| Business Unit 1 | Business Unit 2 | Business Unit 3 | Business Unit 4 | |
|---|---|---|---|---|
| Industry attractiveness | Decrease | Stay the same | Stay the same | Increase |
| Business unit competitive strength | Decrease | Increase | Increase | Decrease |
Step 6. Prioritize your investments
The last step is to decide where and how to invest the company’s money. While the matrix makes it easier by evaluating the business units and identifying the best ones to invest in, it still doesn’t answer some very important questions:
- Is it really worth investing into some business units?
- How much exactly to invest in?
- Where to invest into business units (more to R&D, marketing, value chain?) to improve their performance?
Doing the GE McKinsey matrix and answering all the questions takes time, effort and money, but it’s still one of the most important product portfolio management tools that significantly facilitate investment decisions.
Sources
- McKinsey & Company (2008). Enduring Ideas: The GE–McKinsey nine-box matrix.
- David, F.R. (2009). Strategic Management: Concepts and Cases. 12th ed. FT Prentice Hall
- Wiki (2008). BCG Matrix & GE/McKinsey Matrix.