Definition
The Competitive Profile Matrix (CPM) is a tool that compares the firm and its rivals and reveals their relative strengths and weaknesses.
What is the Competitive Profile Matrix
Firms often use CPM to better understand the external environment and the competition in a particular industry. The matrix identifies a firm’s key competitors and compares them using industry’s critical success factors.
The analysis also reveals company’s relative strengths and weaknesses against its competitors, so a company would know, which areas it should improve and, which areas to protect. An example of a matrix is demonstrated below.
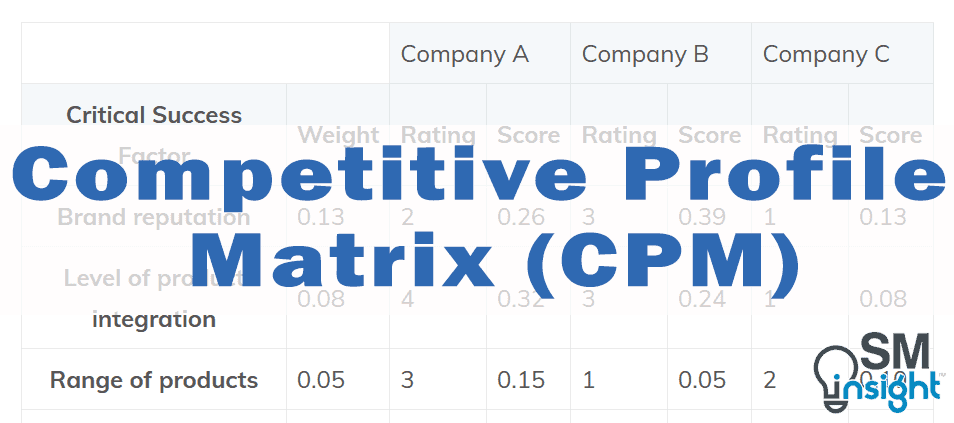
CPM Table
| Company A | Company B | Company C | |||||
| Critical Success Factor | Weight | Rating | Score | Rating | Score | Rating | Score |
|---|---|---|---|---|---|---|---|
| Brand reputation | 0.13 | 2 | 0.26 | 3 | 0.39 | 1 | 0.13 |
| Level of product integration | 0.08 | 4 | 0.32 | 3 | 0.24 | 1 | 0.08 |
| Range of products | 0.05 | 3 | 0.15 | 1 | 0.05 | 2 | 0.10 |
| Successful new introductions | 0.04 | 3 | 0.12 | 3 | 0.12 | 3 | 0.12 |
| Market Share | 0.14 | 2 | 0.28 | 4 | 0.56 | 4 | 0.56 |
| Sales per employee | 0.08 | 1 | 0.08 | 2 | 0.16 | 3 | 0.24 |
| Low cost structure | 0.05 | 1 | 0.05 | 3 | 0.15 | 4 | 0.20 |
| Variety of distribution channels | 0.07 | 4 | 0.28 | 2 | 0.14 | 2 | 0.14 |
| Customer retention | 0.02 | 2 | 0.04 | 4 | 0.08 | 1 | 0.02 |
| Superior IT capabilities | 0.11 | 3 | 0.33 | 4 | 0.44 | 4 | 0.44 |
| Strong online presence | 0.15 | 3 | 0.45 | 3 | 0.45 | 4 | 0.60 |
| Successful promotions | 0.08 | 1 | 0.08 | 2 | 0.16 | 1 | 0.08 |
| Total | 1.00 | – | 2.44 | – | 2.94 | – | 2.71 |
Critical Success Factors
Critical success factors (CSF) are the key areas that must be performed at the highest possible level of excellence if organizations want succeed in a particular industry. They vary between different industries or even strategic groups and include both internal and external factors.
In our example, we have included 11 CSFs, which is usually not enough. The more critical success factors are included, the more robust and accurate the analysis is. The following list provides some of the general CSF, but the list is not definite and you should include industry-specific factors in your matrix:
| Market Share | Union relations | Power over suppliers |
| Product Quality | Skilled workforce | Access to key suppliers |
| Clear strategic direction | Location of facilities | Efficient supply chain |
| Customer service | Production capacity | Supply chain integration |
| Customer loyalty | Added product features | On time delivery |
| Brand reputation | Price competitiveness | Strong online presence |
| Customer satisfaction | Low cost structure | Effective social media management |
| Financial position | Variety of products | Experience and skills in e-commerce |
| Cash reserves | Complementary products | Management qualification and experience |
| Profit margin | Level of product integration | Innovation in products and services |
| Inventory turnover | Successful product promotions | Innovative culture |
| Employee retention | Superior marketing capabilities | Efficient production |
| Income per employee | Superior advertising capabilities | Lean production system |
| Innovations per employee | Superior IT capabilities | Strong supplier network |
| Cost per employee | Size of advertising budget | Strong distribution network |
| R&D spending | Effectiveness of sales distribution | Product design |
| Strong patent portfolio | Employee satisfaction | Level of vertical integration |
| New patents per year | Effective planning and budgeting | Effective corporate social responsibility programs |
| Revenue per new product | Variety of distribution channels | Sales per outlet |
| Successful new introductions | Power over distributors | Parent company support |
Weight
Each critical success factor should be assigned a weight ranging from 0.0 (low importance) to 1.0 (high importance). The number indicates how important the factor is in succeeding in the industry. If there were no weights assigned, all factors would be equally important, which is an impossible scenario in the real world.
The sum of all the weights must equal 1.0. Separate factors should not be given too much emphasis (assigning a weight of 0.3 or more) because success in an industry is rarely determined by one or few factors. In our first example, the most significant factors are ‘strong online presence’ (0.15), ‘market share’ (0.14), ‘brand reputation’ (0.13).
Rating
The ratings in CPM refer to how well companies are doing in each area. They range from 4 to 1, where 4 means a major strength, 3 – minor strength, 2 – minor weakness and 1 – major weakness. Ratings, as well as weights, are assigned subjectively to each company, but the process can be done easier through benchmarking.
Benchmarking reveals how well companies are doing compared to each other or industry’s average. Just remember that firms can be assigned equal ratings for the same factor. For example, if Company A, Company B and Company C, have market share of 25%, 27% & 28% accordingly, they would all receive the rating of 4 rather than receiving ratings 2, 3 & 4.
Score & Total Score
The score is the result of weight multiplied by the rating. Each company receives a score on each factor. The total score is simply the sum of all individual scores for the company. The firm that receives the highest total score is relatively stronger than its competitors. In our example, the strongest performer in the market should be Company B (2.94 points).
Benefits of the CPM:
- The same factors are used to compare the firms. This makes the comparison more accurate.
- The analysis displays the information on a matrix, which makes it easy to compare the companies visually.
- The results of the matrix facilitate decision-making. Companies can easily decide which areas they should strengthen and protect or what strategies they should pursue.
Using the tool
Step 1. Identify the critical success factors
To make it easier, use our list of CSFs and include as many factors as possible. In addition, following questions should be helpful identifying industry’s CSF:
- Why do consumers prefer Company A over Company B or vice versa?
- What resources, capabilities and competencies do firms possess?
- What sustainable competitive advantages do companies have in the industry?
- Why do some companies succeed and others fail in the industry?
Step 2. Assign the weights and ratings
The best way to identify what weights should be assigned to each factor is to compare the best and worst-performing companies in the industry. Well-performing companies will usually undertake activities that are significant for success in the industry.
They will put most of their resources and energy into those activities compared to low-performing organizations. Weights can also be determined in discussions with other top-level managers.
Ratings should be assigned using benchmarking or during team discussions.
Step 3. Compare the scores and take action
You should compare the scores on each factor to identify where the company’s relative strengths and weaknesses. In our first example, Company A had relative strength in ‘level of product integration’, ‘product range’ and ‘variety of distribution channels’. Therefore, Company A should protect these areas while trying to improve its weaknesses in ‘sales per employee’ and ‘market share’.
The company should also improve its strategy to become more successful in the industry.
Example
This is a competitive profile matrix example of smartphone operating systems. The main competitors: Google’s Android OS, Apple’s iOS and Microsoft’s Windows Phone operating systems will be compared to each other to find out their relative strengths and weaknesses.
CPM Example
| Android OS | iOS | Windows Phone | |||||
| Critical Success Factor | Weight | Rating | Score | Rating | Score | Rating | Score |
|---|---|---|---|---|---|---|---|
| Market share | 0.13 | 4 | 0.52 | 2 | 0.26 | 2 | 0.26 |
| Number of apps in store | 0.10 | 4 | 0.40 | 4 | 0.40 | 2 | 0.20 |
| Frequency of updates | 0.06 | 3 | 0.18 | 4 | 0.24 | 2 | 0.12 |
| Design | 0.07 | 3 | 0.21 | 3 | 0.21 | 3 | 0.21 |
| Product brand reputation | 0.05 | 3 | 0.15 | 3 | 0.15 | 2 | 0.10 |
| Distribution channels | 0.11 | 4 | 0.44 | 2 | 0.22 | 3 | 0.33 |
| Usability | 0.11 | 3 | 0.33 | 3 | 0.33 | 3 | 0.33 |
| Customization features | 0.04 | 4 | 0.16 | 2 | 0.08 | 2 | 0.08 |
| Marketing capabilities | 0.04 | 2 | 0.08 | 4 | 0.16 | 2 | 0.08 |
| Company brand reputation | 0.10 | 4 | 0.40 | 4 | 0.40 | 3 | 0.30 |
| Openness | 0.02 | 4 | 0.08 | 2 | 0.04 | 2 | 0.04 |
| Cloud integration | 0.12 | 4 | 0.48 | 2 | 0.24 | 2 | 0.24 |
| Rate of OS crashes | 0.08 | 1 | 0.08 | 4 | 0.32 | 3 | 0.24 |
| Total | 1.00 | – | 3.51 | – | 3.05 | – | 2.53 |
The CPM analysis reveals that Android is the strongest player in the industry with relative strengths in market share, distribution channels, customization features, openness and cloud integration. On the other hand, iOS prevails in frequency updates, marketing capabilities and the rate of OS crashes.
Windows Phone is the weakest of them all and doesn’t have any relative strengths against its rivals. The companies should create their strategies according to their strengths and weaknesses and improve their ratings in the most significant industry areas.