
Definition
BCG matrix (or growth-share matrix) is a corporate planning tool which is used to portray a firm’s brand portfolio or SBUs on a quadrant along the relative market share axis (horizontal axis) and speed of market growth (vertical axis) axis.
Growth-share matrix is a business tool which uses relative market share and industry growth rate factors to evaluate the potential of a business brand portfolio and suggest further investment strategies.
What is the Boston Consulting Group (BCG) Growth-Share Matrix
BCG matrix is a framework created by Boston Consulting Group to evaluate the strategic position of the business brand portfolio and its potential. It classifies a business portfolio into four categories based on industry attractiveness (growth rate of that industry) and competitive position (relative market share).
These two dimensions reveal the likely profitability of the business portfolio in terms of cash needed to support that unit and the cash generated by it. The general purpose of the analysis is to help understand which brands the firm should invest in and which ones should be divested.
Relative market share. One of the dimensions used to evaluate a business portfolio is relative market share. Higher corporate market share results in higher cash returns. This is because a firm that produces more, benefits from higher economies of scale and experience curve, which results in higher profits. Nonetheless, it is worth to note that some firms may experience the same benefits with lower production outputs and lower market share.
Market growth rate. High market growth rate means higher earnings and sometimes profits but it also consumes lots of cash, which is used as an investment to stimulate further growth. Therefore, business units that operate in rapid-growth industries are cash users and are worth investing in only when they are expected to grow or maintain market share in the future.
There are four quadrants into which firm brands are classified:
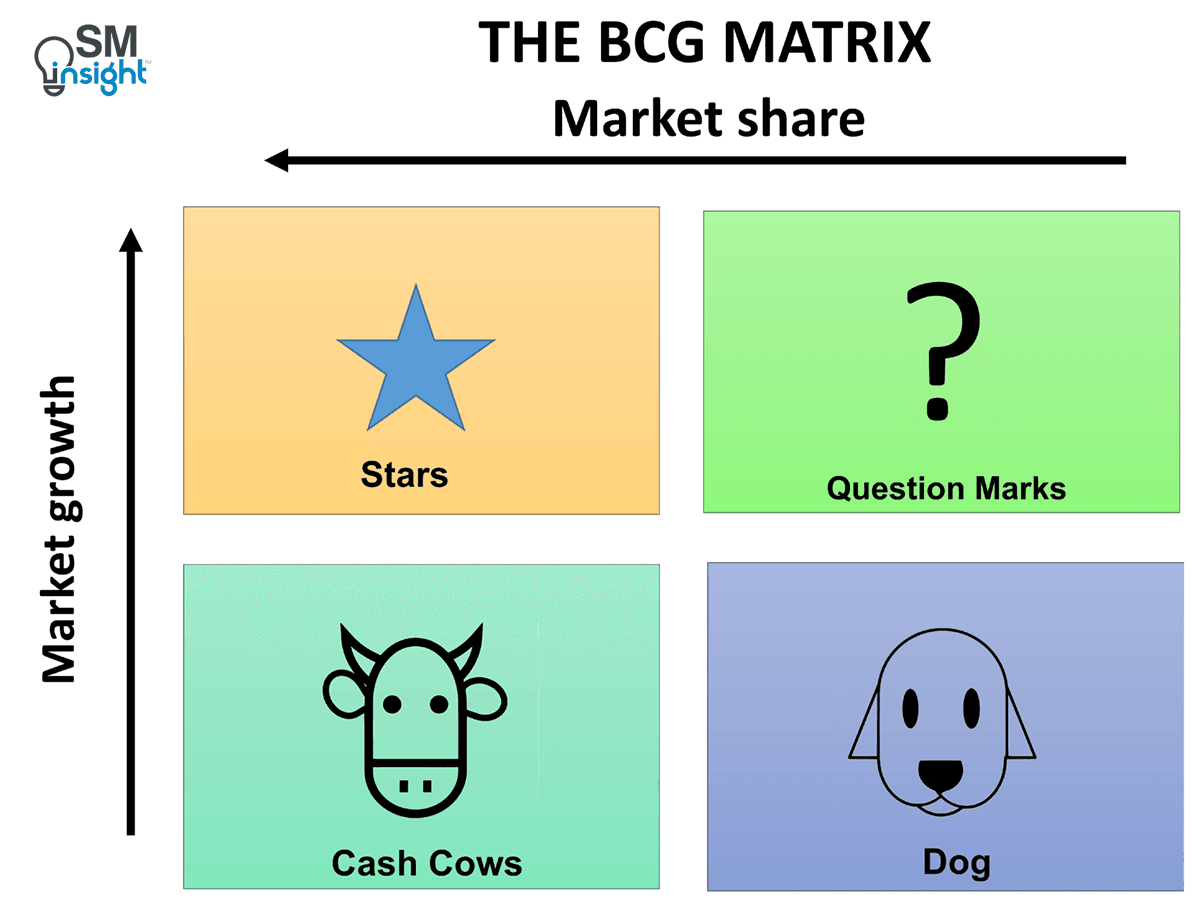
Dogs
Dogs hold a low market share compared to competitors and operate in a slowly growing market. In general, they are not worth investing in because they generate low or negative cash returns. But this is not always the truth.
Some dogs may be profitable for a long period of time, they may provide synergies for other brands or SBUs or simply act as a defense to counter competitors’ moves. Therefore, it is always important to perform a deeper analysis of each brand or SBU to make sure they are not worth investing in or have to be divested.
Strategic choices: Retrenchment, divestiture, liquidation
Cash cows
Cash cows are the most profitable brands and should be “milked” to provide as much cash as possible. The cash gained from “cows” should be invested in stars to support their further growth.
According to the growth-share matrix, corporates should not invest in cash cows to induce growth but only to support them so they can maintain their current market share. Again, this is not always the truth.
Cash cows are usually large corporations or SBUs that are capable of innovating new products or processes, which may become new stars. If there would be no support for cash cows, they would not be capable of such innovations.
Strategic choices: Product development, diversification, divestiture, retrenchment
Stars
Stars operate in high-growth industries and maintain high market share. Stars are both cash generators and cash users. They are the primary units in which the company should invest its money, because stars are expected to become cash cows and generate positive cash flows.
Yet, not all stars become cash flows. This is especially true in rapidly changing industries, where new innovative products can soon be outcompeted by new technological advancements, so a star instead of becoming a cash cow, becomes a dog.
Strategic choices: Vertical integration, horizontal integration, market penetration, market development, product development
Question marks
Question marks are the brands that require much closer consideration. They hold low market share in fast-growing markets, consuming large amounts of cash and incurring losses. It has the potential to gain market share and become a star, which would later become a cash cow.
Question marks do not always succeed and even after a large amount of investments they struggle to gain market share and eventually become dogs. Therefore, they require very close consideration to decide if they are worth investing in or not.
Strategic choices: Market penetration, market development, product development, divestiture
BCG matrix quadrants are simplified versions of reality and cannot be applied blindly. They can help as general investment guidelines but should not change strategic thinking. Businesses should rely on management judgment, business unit strengths and weaknesses and external environment factors to make more reasonable investment decisions.
Advantages and disadvantages
Benefits of the matrix:
- Easy to perform;
- Helps to understand the strategic positions of the business portfolio;
- It’s a good starting point for further, more thorough analysis.
Growth-share analysis has been heavily criticized for its oversimplification and lack of useful application. The following are the main limitations of the analysis:
- Business can only be classified into four quadrants. It can be confusing to classify an SBU that falls right in the middle.
- It does not define what ‘market’ is. Businesses can be classified as cash cows while they are actually dogs, or vice versa.
- Does not include other external factors that may change the situation completely.
- Market share and industry growth are not the only factors of profitability. Besides, high market share does not necessarily mean high profits.
- It denies that synergies between different units exist. Dogs can be as important as cash cows to businesses if they help to achieve competitive advantage for the rest of the company.
Using the tool
Although BCG analysis has lost its importance due to many limitations, it can still be a useful tool if performed by following these steps:
- Step 1. Choose the unit
- Step 2. Define the market
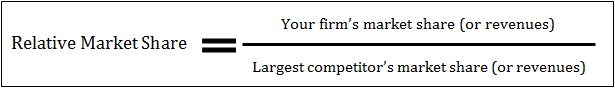
- Step 3. Calculate relative market share
- Step 4. Find out market growth rate
- Step 5. Draw the circles on a matrix
Step 1. Choose the unit. BCG matrix can be used to analyze SBUs, separate brands, products or a firm as a unit itself. Which unit will be chosen will have an impact on the whole analysis. Therefore, it is essential to define the unit for which you’ll do the analysis.
Step 2. Define the market. Defining the market is one of the most important things to do in this analysis. This is because an incorrectly defined market may lead to poor classification. For example, if we would do the analysis for the Daimler’s Mercedes-Benz car brand in the passenger vehicle market it would end up as a dog (it holds less than 20% relative market share), but it would be a cash cow in the luxury car market. It is important to clearly define the market to better understand firm’s portfolio position.
Step 3. Calculate relative market share. Relative market share can be calculated in terms of revenues or market share. It is calculated by dividing your own brand’s market share (revenues) by the market share (or revenues) of your largest competitor in that industry. For example, if your competitor’s market share in the refrigerator’s industry was 25% and your firm’s brand market share was 10% in the same year, your relative market share would be only 0.4. Relative market share is given on the x-axis. Its top left corner is set at 1, the midpoint at 0.5, and the top right corner at 0 (see the example below for this).
Step 4. Find out the market growth rate. The industry growth rate can be found in industry reports, which are usually available online for free. It can also be calculated by looking at the average revenue growth of the leading industry firms. Market growth rate is measured in percentage terms. The midpoint of the y-axis is usually set at a 10% growth rate, but this can vary. Some industries grow for years but at an average rate of 1 or 2% per year. Therefore, when doing the analysis you should find out what growth rate is seen as significant (midpoint) to separate cash cows from stars and question marks from dogs.
Step 5. Draw the circles on a matrix. After calculating all the measures, you should be able to plot your brands on the matrix. You should do this by drawing a circle for each brand. The size of the circle should correspond to the proportion of business revenue generated by that brand.
Examples
Corporate ‘A’ BCG matrix
| Brand | Revenues | % of corporate revenues | Largest rival’s market share | Your brand’s market share | Relative market share | Market growth rate |
|---|---|---|---|---|---|---|
| Brand 1 | $500,000 | 54% | 25% | 25% | 1 | 3% |
| Brand 2 | $350,000 | 38% | 30% | 5% | 0.17 | 12% |
| Brand 3 | $50,000 | 6% | 45% | 30% | 0.67 | 13% |
| Brand 4 | $20,000 | 2% | 10% | 1% | 0.1 | 15% |
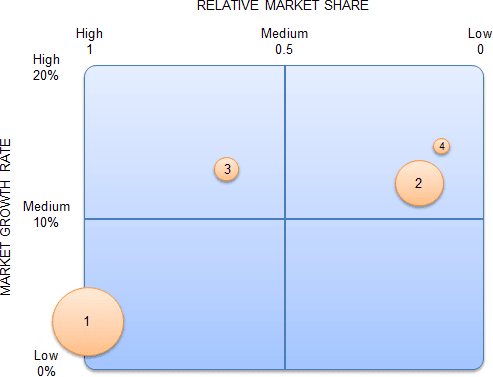
This example was created to show how to deal with a relative market share higher than 100% and with negative market growth.
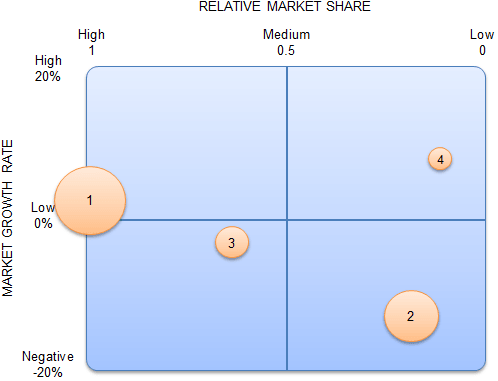
Corporate ‘B’ BCG matrix
| Brand | Revenues | % of corporate revenues | Largest rival’s market share | Your brand’s market share | Relative market share | Market growth rate |
|---|---|---|---|---|---|---|
| Brand 1 | $500,000 | 55% | 15% | 60% | 1 | 3% |
| Brand 2 | $350,000 | 31% | 30% | 5% | 0.17 | -15% |
| Brand 3 | $50,000 | 10% | 45% | 30% | 0.67 | -4% |
| Brand 4 | $20,000 | 4% | 10% | 1% | 0.1 | 8% |
Sources
- Wikipedia (2013). Growth-share matrix. Available at: https://en.wikipedia.org/wiki/Growth%E2%80%93share_matrix
- Costa, C. (2012). Evaluating Product Lines Using the BCG Matrix (VIDEO). Available at: https://www.youtube.com/watch?v=Uuuxs9gO8C0
By looking at above given examples of relative market share we can analyse that neither of the investments are fixed but the maximum output that we can gain is from higher market share and higher brand market.