This Samsung SWOT analysis reveals how the second largest technology company used its competitive advantages to become a leader in consumer electronics, home appliances and semiconductors industries.
It identifies all the key strengths, weaknesses, opportunities and threats that affect the company the most. If you want to find out more about the SWOT of Samsung, you’re in the right place.
Learn how to do a SWOT analysis.
Company Overview
| Name | Samsung Electronics Co., Ltd. |
|---|---|
| Founded | January 13, 1969 |
| Logo |  |
| Industries served | Consumer electronics Telecoms equipment Semiconductors Home appliances |
| Geographic areas served | Worldwide (79 countries) |
| Headquarters | Suwon, Gyeonggi Province, South Korea |
| Executives | Dr. Kye Hyun Kyung (President & CEO, Device Solutions Division) Dr. Jung-Bae Lee (President & GM, Memory Business, Device Solutions Division) Mr. Yong-In Park (President, System LSI Business, Device Solutions Division) Dr. Siyoung Choi (President & GM Foundry Business, Device Solutions Division) |
| Revenue (US$) | $219.17 billion (2024) |
| Profit (US$) | $22.468 billion (2024) |
| Employees | 270,372 (2023) |
| Parent | Samsung Group |
| Main Competitors | Apple Inc., Nokia OYJ, Intel Corporation, LG Display and LG Electronics, Sony Corporation, Texas Instruments Inc., Lenovo Group Limited, Hewlett-Packard Company, Sanyo Electric Co., Ltd., Toshiba Corporation, SK Hynix Inc., Western Digital Corporation and many other consumer electronics, telecommunications equipment, semiconductor and home appliance companies. |
Business Description
Samsung Electronics Co., Ltd. (further Samsung), a part of the Samsung Group, is the world’s second largest technology company by revenue. The company produces consumer electronics, telecommunications equipment, semiconductors and home appliances. Samsung operates three business divisions:
- Consumer Electronics – Visual Display Business, Digital Appliances Business, Printing Solutions Business and Health & Medical Equipment Business.
- IT and Mobile Communications – Mobile Communications Business and Networks Business.
- Device Solutions – Memory Business, System LSI Business and LED Business.
The company is the world’s largest mobile phone and smartphone vendor. It is also the largest memory chip, TV and refrigerator manufacturer. Samsung operates in 79 countries, where it sells a range of more than 100 products.
Samsung SWOT Analysis
| Strengths | Weaknesses |
|---|---|
| 1. Very high research and development (R&D) expenditure resulting in one of the strongest patent portfolios among technology companies 2. Industry leadership in most of the markets the company operates 3. Brand recognition and reputation 4. Enormous advertising and marketing budget 5. Product innovation and design capabilities 6. Vertical integration and manufacturing outsourcing results in low production costs | 1. Too many smartphone models 2. Positioning the company as a high-tier, mid-tier and low-tier smartphone vendor 3. Dependence on Google’s Android OS provides little control over the user experience |
| Opportunities | Threats |
|---|---|
| 1. Introduce a separate low-end smartphone brand to counter the expansion of OPPO and Xiaomi smartphones 2. The Internet of Things (IoT) market is expected to grow significantly over the next decade 3. Enter the growing wireless chipset market 4. Augmented and virtual reality markets will be around US$100 billion by 2023 5. Increasing demand for voice-controlled virtual assistants in home devices | 1. Smartphones using Android OS are becoming a commodity, which could impact the company’s gross margins 2. Intensifying competition in almost every market in which Samsung operates 3. New patent infringements resulting in negative publicity affecting the company’s reputation |
Strengths
1. Very high research and development (R&D) expenditure resulting in one of the strongest patent portfolios among technology companies
Innovation is crucial to succeeding in the technology sector. Usually, the more a business invests in R&D, the more innovations it creates. Samsung operates 34 R&D centers across the world. The company has spent US$14.857 billion on R&D in 2017, which was the 2nd largest amount spent in the world.[1] R&D spending strongly correlates with a company’s revenue growth and expansion into the new product markets.
Figure 1. R&D spending by Samsung and its largest competitors (in US$ billions and percentages)
| Company | 2016 | As a % of revenues | 2017 | As a % of revenues |
|---|---|---|---|---|
| Samsung Electronics | 13.079 | 7.3 | 14.857 | 7 |
| Apple | 10.045 | 4.7 | 11.581 | 5.1 |
| Microsoft | 11.989 | 14.1 | 13.037 | 14.5 |
| Intel | 12.128 | 21.9 | 13.098 | 20.7 |
| Amazon.com | 12.540 | 11.7 | 22.620 | 12.7 |
| LG Electronics | 2.183 | 4.5 | 2.110 | 3.9 |
Source: Companies’ respective financial reports[1][2][3][4][5][6]
In 2017, Samsung’s investment in R&D was the 2nd largest among technology companies only behind Amazon.com. Samsung’s R&D budget was also used efficiently as the company spent only 7.3% and 7% of its total revenues on R&D in 2016 and 2017, respectively.
Samsung’s high R&D spending has resulted in it developing the largest patent portfolio among its key rivals. The following table shows the number of patents granted for each company in the U.S. during 2015-2017.
Figure 2. Utility patents granted in the U.S.
| Company | 2015 | 2016 | 2017 | Total |
|---|---|---|---|---|
| Samsung Electronics | 5,059 | 5,504 | 5,810 | 16,373 |
| Apple | 1,937 | 2,101 | 2,225 | 6,263 |
| Microsoft | 2,408 | 2,398 | 2,440 | 7,246 |
| Intel | 2,046 | 2,779 | 3,021 | 7,846 |
| Amazon.com | 1,136 | 1,662 | 1,960 | 4,758 |
| LG Electronics | 2,241 | 2,426 | 2,696 | 6,786 |
Source: U.S. Patent and Trademark Office[7][8][9]
The more patents a company has, the better position it is in to defend its innovations from being copied by rivals. Currently, Samsung’s patents portfolio is one of the strongest in the technology industry.
Both its R&D spending and patent portfolio are factors that indicate Samsung’s strong competitive position in the markets in which it operates.
2. Industry leadership in most of the markets the company operates
Samsung is the second largest technology company by revenue in the world. It is the leader in many product markets, including:
- LCD TVs – according to Statista, Samsung manufactured 20.2% or one in five TVs in 2017. Only LG Electronics comes close to Samsung, producing 12.1% of all manufactured TVs.
Figure 3. Global market share held by LCD TV manufacturers in 2017
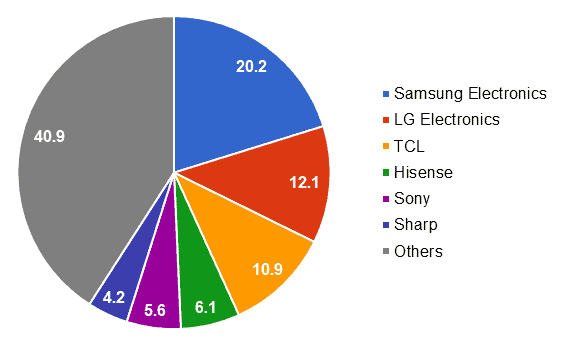
Source: Statista[10]
- NAND Flash memory – Samsung manufactures over a third of all NAND flash memory chips.
Figure 4. Global market share held by NAND Flash memory manufacturers worldwide
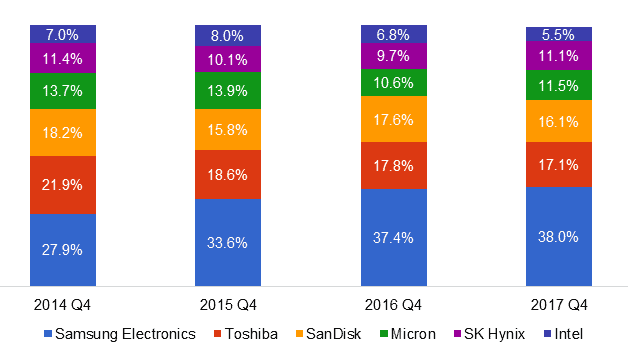
Source: Statista[11]
- Smartphones – Samsung is also the largest vendor of smartphones in the world. In 2017, it shipped 317.3 million units or 21.6% of all smartphones.[12]
Figure 5. Worldwide smartphone vendor market share in 2017 (in percentages)
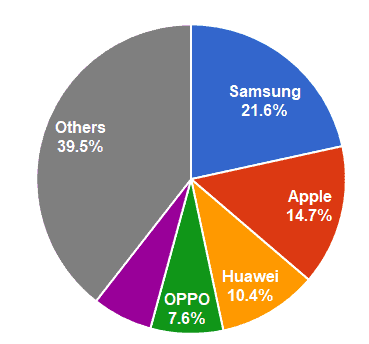
Source: International Data Corporation (IDC)[12]
Samsung holds the market leadership position in many of the industries in which it operates. Due to its size and dominant market share it can exercise its market power on component providers, distributors and competitors. It is able to invest large amounts of money into R&D and advertising, which further strengthens its position and brand recognition.
3. Brand recognition and reputation
The Samsung brand is one of the most valuable and recognizable in the world. The company’s brand recognition has been mainly fueled by its success in the smartphone, mobile phone and TV set industries. According to Interbrand[13] and Forbes[14], Samsung’s brand is the 6th and 10th most valuable in the world, worth US$56.249 billion and US$38.2 billion, respectively. Samsung brand’s value is also one of the fastest growing among all technology companies.
The brand value is closely related to the brand recognition and reputation. Usually, the more valuable a brand is the better it is recognized worldwide. Samsung Electronics, which operates in 79 countries, enjoys some of the greatest brand awareness among all global corporations.
Figure 6. Samsung brand value 2000-2017
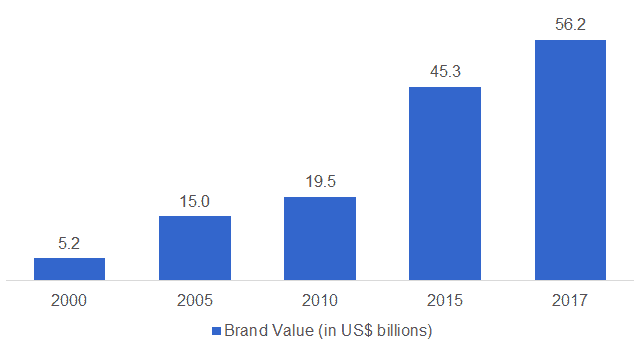
Source: Interbrand[15][16][17][18][13]
Samsung’s brand recognition and reputation helps the company to attract new customers, increase customer loyalty and sell its products.
4. Enormous advertising and marketing budget
Samsung’s advertising budget was US$4.731 billion in 2017 – the second largest among all of its competitors.
Figure 7. Yearly advertising budget spending by Samsung and its competitors (in US$ billions)
| Company | 2016 | 2017 | Change from 2016 |
|---|---|---|---|
| Samsung Electronics | 3.919 | 4.731 | 20.7% |
| Apple | – | – | – |
| Microsoft | 1.6 | 1.5 | (6.3)% |
| Intel | 1.8 | 1.4 | (22.2)% |
| Amazon.com | 5 | 6.3 | 26% |
| LG Electronics | 1.169 | 1.106 | (5.3)% |
Source: The respective companies’ financial reports[1][2][3][4][5][6]
Samsung’s total marketing budget, which includes all expenses related to selling its products, was over US$11 billion in 2017, more than any of its competitors.
While Samsung’s marketing capabilities are not as effective as Apple’s, its huge advertising spending has its advantages. The company’s products have become more prominent and users are more willing to buy products bearing the Samsung logo as a result. Extensive advertising campaigns allow the company to push new products more easily into the market. There is no doubt that Samsung would not have sold nearly as many wearable gadgets or newest smartphone models as it has, without its advertising efforts.
5. Product innovation and design capabilities
Samsung has long been viewed as an innovative company that is capable of producing well designed and ecologically friendly products. This is proven by the many awards the company has received over the years. The prestigious Consumer Electronics Show (CES) awarded Samsung for its innovation and product design 14 years in a row. The company received 36 CES 2018 innovation awards, including 2 ‘Best of Innovation’ awards, and has received more than 400 awards over the last 14 years.[19]
In 2017, Samsung has also received 7 International Design Excellence Awards (IDEA) awards.[20] Since 2009, Samsung has won the most (IDEA) awards among all nominated companies”.[21]
The company’s commitment to producing ecologically friendly products and to decrease its greenhouse gas emissions has also been recognized. Since 2009, Samsung has consistently been recognized for its leadership in driving eco-innovations. For the fifth consecutive year the company received the Environmental Protection Agency’s (EPA) annual ENERGY STAR Partner of the Year – Sustained Excellence Award.
Samsung also ranked at No. 9 onto the EPA’s 2016 Green Power Partner list for Top 30 Tech and Telecom companies recognized for significant renewable energy investments.[22]
Few other companies have received as many awards for innovation and eco-friendly product design as Samsung. This enhances the company’s reputation, increasing brand awareness and sales.
6. Vertical integration and manufacturing outsourcing results in low production costs
(note that this strength mainly applies to Samsung’s smartphone business)
Samsung’s smartphone business is vertically integrated. The company designs, manufactures, markets and sells its own smartphones. The key for any vertically integrated business is to manage activities inside the organization to achieve lower costs than it would externally.
This is exactly what Samsung is doing. Unlike other smartphone developers, Samsung manufactures its own chips, processors, displays and batteries. This reduces the costs of these key inputs that are used in smartphones and results in lower overall production costs. Samsung’s devices are also the first ones to receive the best in industry components that provide a competitive advantage for the company’s products.
The company also continuously how to reduce its production costs and outsources most of its manufacturing and assembly jobs to low-cost countries. If the country, to which Samsung has moved its manufacturing operations, becomes too expensive, the company moves its manufacturing yet again to keep its production costs as low as possible.
Therefore, vertical integration helps the company to sell its products at moderate prices while maintaining acceptable operating profit margins. Few of its competitors have such a strength.
Weaknesses
1. Too many smartphone models
Samsung reported a fall in operating profits of 32% in 2014, the decline fueled by increased competition and the high costs incurred in developing the high number of smartphone models it releases every year. Samsung’s immediate response to stop the decline of its operating profits was to reduce the number of smartphone models by 30% in 2015.[23]
This tactic helped Samsung to stop its operating profit decline, but the company still relies on a huge number of smartphone models to capture its market share.
According to GSM Arena[24], Samsung released 21 new models in 2017, which is more than what HTC (10), LG (15) or Apple (only 3 new iPhones) have released. The company’s smartphone portfolio is extremely large and that brings its own drawbacks, the major ones being:
- increased costs of designing new models
- complexity of supply chain
- lower economies of scale
- difficulty of marketing so many products to different consumer segments.
To increase its operating profit and to focus on key models, the company could further reduce its smartphone portfolio.
2. Positioning the company as a high-tier, mid-tier and low-tier smartphone vendor
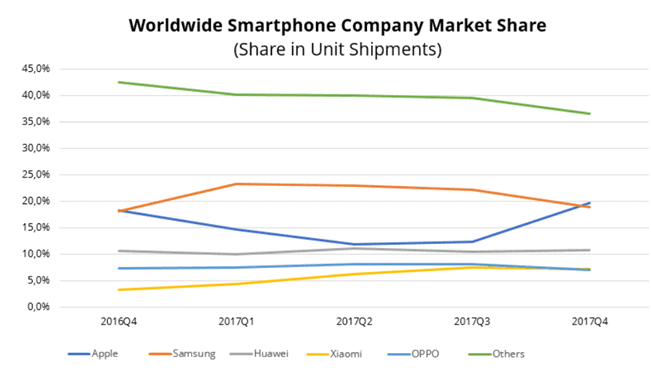
Samsung is the largest smartphone manufacturer in the world and has one of the largest smartphone portfolios among its competitors. However, the company is over-positioning itself in the smartphone market, which weakens its overall position against the rivals.
Figure 8. Worldwide smartphone vendor market share (in percentages)
| Period | Samsung | Apple | Huawei | Xiaomi | OPPO | Others |
|---|---|---|---|---|---|---|
| 2016 Q4 | 18.0 | 18.2 | 10.6 | 3.3 | 7.3 | 42.5 |
| 2017 Q1 | 23.3 | 14.7 | 10.0 | 4.3 | 7.5 | 40.2 |
| 2017 Q2 | 22.9 | 11.8 | 11.1 | 6.2 | 8.0 | 40.0 |
| 2017 Q3 | 22.1 | 12.4 | 10.4 | 7.5 | 8.1 | 39.5 |
| 2017 Q4 | 18.9 | 19.7 | 10.7 | 7.2 | 6.9 | 36.6 |
Source: IDC[25]
Samsung’s large smartphone portfolio allows it to target more consumer segments and capture a large market share, but this also adds to its production costs. That’s one reason why Samsung’s strategy to position itself as a high-tier, mid-tier and low-tier smartphone vendor is a weakness.
The second reason is that the company is incapable of focusing on the one or two most important consumer segments and loses its competitive advantage in those markets. Currently, Samsung successfully competes in its most profitable high-end smartphone business with Apple and Huawei, but is losing market share to OPPO and Xiaomi at the low-end and to Lenovo in the mid-level smartphone segments. That’s because the company can’t effectively compete in all segments at the same time.
3. Dependence on Google’s Android OS provides little control over the user experience
Samsung doesn’t have its own OS and has to rely on Google’s Android OS for its smartphones and tablets. This lack of a proprietary OS makes Samsung vulnerable as smartphones are becoming a commodity and it is harder for the company to distinguish its products from rivals’ offerings. Other disadvantages Samsung experiences due to their Android OS dependence include:
- Little control over OS development. Samsung has to rely on Google to develop the Android ecosystem. The company also doesn’t have any control over OS updates their timing of release, or security. The result is that Samsung has little control over their users’ experience.
- Component and device integration issues. Samsung’s devices contain many separate components that need to be integrated with the OS, which is made more complicated when the company doesn’t control the OS. Integration between devices is also harder to achieve when relying on an external OS.
- Lost revenues from app sales. If Samsung is able to develop its Tizen OS it has the potential to achieve a significant amount of revenue from app sales. Currently, only Apple, Google and Microsoft benefit from app sales.
Opportunities
1. Introduce a separate low-end smartphone brand to counter the expansion of OPPO and Xiaomi smartphones
Samsung’s worldwide smartphone market share plunged to just 18.9% in 2017, one of lowest levels in 5 years.[12]
Figure 9. Worldwide smartphone vendor market share (in shipment units)
Source: IDC[25]
The main reason for this is their loss of market share in China and other developing countries where companies like OPPO, Xiaomi and vivo are expanding rapidly. They offer low-end smartphone models with moderate hardware and design at very cheap prices, that provide comparable quality to some of the Samsung smartphone models.
This is where Samsung’s weakness in targeting all smartphone market segments could become an opportunity. In order to compete with these low-end smartphone vendors Samsung could introduce a cheap smartphone line and use a different approach for this ‘new’ brand to increase their market share in this segment. Currently, Samsung is using its Galaxy brand for nearly all of its smartphones, diluting the reputation of their high-end smartphones. The Galaxy branding does not help to distinguish the quality of Samsung’s smartphone range. The company also uses similar components and methods to build both its low-tier and high-tier smartphones, making its low-end phones more expensive than competitors’ options.
Therefore, a new branding and manufacturing approach for its cheaper smartphone models would help the Samsung to counter the expansion of competing low-end smartphone brands.
2. The Internet of Things (IoT) market is expected to grow significantly over the next decade
According to Gartner [26], the Internet of Things is “is the network of physical objects that contain embedded technology to communicate and sense or interact with their internal states or the external environment.”. In other words, all devices like cars, smartphones, computers, refrigerators, dishwashers, dryers and any other devices that are connected through Wi-Fi or Bluetooth can be called the IoT. The IoT market is a very lucrative market, in which all technology companies fiercely compete to gain market share.
Currently, over 20 billion devices are connected to the Internet and this number is expected to grow by 50% to 30 billion by 2020.[27] Markets&Markets forecasts that the worldwide market for the IoT will grow from US$170.57 billion in 2017 to US$561.05 billion by 2022.[28]
Samsung is in a unique position to capitalize on the growing IoT market. The company offers smartphones, wearable gadgets, tablets, computers, TVs, audio devices, cameras, camcorders, home appliances, security systems and many other products that can be integrated into one ecosystem and controlled via an internet connection. Samsung has also introduced its own OS, called Tizen RT, designed specifically for the IoT. But the company’s OS lacks in security and support from other companies in the industry, so Samsung has to improve it significantly. Such a new OS could become the industry standard for the IoT, significantly expanding and strengthening the Samsung’s ecosystem.
3. Enter the growing wireless chipset market
According to Technavio[29], currently one of the fastest growing semiconductor markets is wireless chipsets. The size of the wireless chipset market was US$14.53 billion in 2016 and is expected to grow to US$17.66 billion by 2021. That’s 21.5% growth in just five years. Another report from Markets and Markets[30] predict that the wireless market will be worth US$19.22 by 2022, growing on average by 3.5% each year.
Figure 10. Wireless chipset market size (in US$ billions)
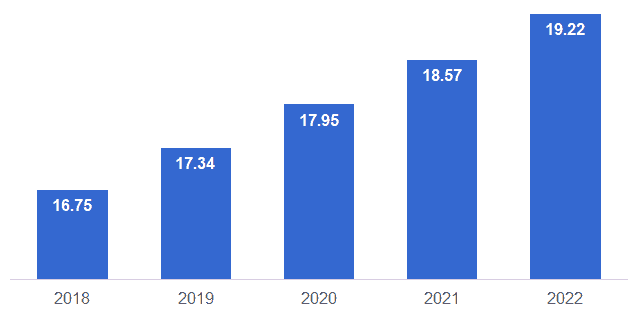
Source: Markets and Markets[30]
The main driver behind the growth of the wireless chipset market has been a huge demand for consumer electronics products, mainly smartphones, with in-built Wi-Fi.
Samsung is one of the key semiconductor manufacturers in the market, with a lot of experience. The company has the right infrastructure to manufacture chipsets and could easily acquire the patents and skills needed to build the technology. Even if Samsung could capture 10% of the market, that would lead to a business worth US$2 billion in revenue by 2022.
4. Augmented and virtual reality markets will be worth US$100 billion by 2023
As tablet sales decline and smartphone markets are becoming more and more saturated, technology companies like Samsung have to look for other growth opportunities. These opportunities could come from the augmented reality (AR) and virtual reality (VR) markets.
In 2018, the AR market is valued at US$11.4 billion while the VR market is expected to generate US$7.9 billion, making the combined market worth US$19.3 billion.[31] Both markets are in their infancy and their real growth is expected in the near future. According to the research done by Research and Markets[31], the AR market could be worth US$60.55 billion by 2023, growing on average by 40.29% every year. The VR market is expected to be smaller, worth US$34.08 billion by 2023, growing on average by 33.95% every year. Both markets are expected to be worth around US$100 billion combined by 2023.
AR and VR will become very profitable growth markets and Samsung should take advantage of this opportunity.
5. Increasing demand for voice-controlled virtual assistants in home devices
In 2017 Samsung has introduced its own virtual assistant (VA) called Bixby. Bixby is the company’s most recent attempt to differentiate itself from rivals through software products.
Smartphones are the primary VA sources, but the current trend is to let the VA into homes and third-party hardware. For example, Amazon has launched Amazon Echo, a speaker that listens to your voice and executes the commands. It allows you to control the connected apps and devices through your voice. Google has a similar device, but with greater capabilities due to their Assistant’s connection to a wider range of devices. Google also allows its virtual assistant to be added to third party hardware. This allows Google to widen its VA product ecosystem. Hardware can be connected and controlled through only one VA and accessed almost anywhere in a house.
Samsung has many ‘smart’ devices that can be connected with each other using wireless connection and integrated into one ecosystem. Therefore, Bixby could potentially become the key software product connecting all of the company’s devices. This way the company could integrate its products into an ecosystem similar to Apple’s or Google’s ecosystems. Samsung could also allow its VA to be added to third party hardware extending the usability of Bixby.
Research from Markets&Markets reveals that the market for intelligent virtual assistants will be worth over US$17.72 billion by 2023.[32] While it’s not the biggest market opportunity for Samsung, the company could increase its efforts on Bixby development. This would strengthen the company’s ecosystem and provide a better user experience.
Threats
1. Smartphones using Android OS are becoming a commodity, which could impact the company’s gross margins
There are two ways smartphone vendors can differentiate their phones from competitors to gain and maintain a competitive advantage. The first is by assembling smartphones with newer, better and more sophisticated components that exceed the capabilities of their rivals. The second is to differentiate through their software and ecosystem. Software delivers the user experience and is the key to how the phone is perceived by the user. It is also an advantage that is nearly impossible to replicate. Vendors who build a great mobile OS experience much greater success than those who rely only on their hardware to differentiate.
Currently, all Samsung smartphones run on Google’s Android OS. The Android OS is used by 85% of the world’s smartphones.[33]
Figure 11. Worldwide smartphone OS market share (in percentages)
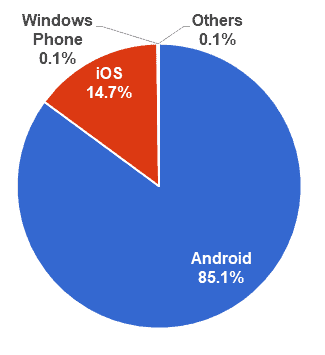
Source: IDC[33]
Only iPhones with iOS, Nokia and BlackBerry smartphones each have their own distinct OS. Although the Android OS is customized for each brand, the user experience is almost the same across all Android phones, so there’s no way for Samsung to differentiate its phones using software.
It is also becoming harder for smartphone manufacturers to differentiate through hardware as the components are becoming cheaper and even low-end smartphone manufacturers can offer smartphone models with similar quality hardware as Samsung’s.
This makes Samsung phones very vulnerable to becoming a commodity, where there is little room for differentiating its products through hardware and no options to differentiate through software.
2. Intensifying competition in almost every market in which Samsung operates
Competition intensifies when new competitors enter a market or when a market’s growth slows significantly. Both of these situations threaten Samsung at the moment.
Smartphone industry growth has slowed and it will experience even slower growth in the future. The industry grew by as much as 75.6% from 2010 to 2011, 62.3% from 2011 to 2012, 46.6% from 2012 to 2013,[34] but only 2.3% in 2016 and has actually declined in 2017.[12] IDC forecasts that smartphone shipments will grow by low single digits in 2018 as well.[25] The main growth comes from developing countries, where Samsung’s high-end smartphones experience considerable competition from the lower priced models of Chinese companies. In developed economies, the smartphone market is nearly saturated and currently competing companies struggle to grow accordingly.
New market entrants are also a threat. Not so long ago, Huawei, OPPO and even Xiaomi were insignificant smartphone vendors, holding less than 10% smartphone market share combined. Now these companies have over 23% market share and their shipments are rising faster than the industry average.[25]
In the TV market rivalry is also intensifying, mainly due to the rise of Chinese brands Hisense, Skyworth and TCL and the U.S. brand Vizio.[10] Hisense and TCL held a combined 17% market share in 2017, compared to only 7.5% in 2010. In the future, TV market competition will only intensify further as these low-cost manufacturers attract even more first time smart TV buyers.
In the mobile processor market, Samsung also experiences intense competition. The company lost its major customer, Apple, who no longer buys mobile processors from Samsung, but from Taiwan Semiconductor Manufacturing Co.
Intensifying competition results in lower revenues and lower operating profit margins for Samsung.
3. New patent infringements resulting in negative publicity affecting the company’s reputation
Samsung is operating in the technology industry where competition is often based on patents. Patents, especially software and design patents, are often vague and rivals often breach them. The consequences are rarely favorable and infringing companies need to pay royalties or damages if they lose legal cases. For example, Samsung once had to pay US$1 billion in damages to Apple. The company has also lost many smaller cases and has had to pay damages accordingly.
There’s no guarantee that Samsung, willingly or not, will not breach more patents in the future, resulting in damages that have to be paid and the associated negative publicity that would hurt the company’s reputation.
Summary
Samsung Electronics should continue strengthening its R&D capabilities and producing ever more innovative hardware and software products. Enormous advertising budget and vertical integration helps, but will not drive company’s future growth. Innovative hardware products help to differentiate in short-term, but only software will allow Samsung to create and offer distinctive products for the consumers.
As for the weaknesses, Samsung should consider streamlining its product offerings not only in the smartphone market, but also in TV set, refrigerator and other products’ markets, where the company offers too many different models. Too many models always increase production costs and confuse consumers.
At the moment, Samsung should pursue wireless chipset market opportunity, which offers the best margins and growth opportunities for the company. Augmented and virtual reality markets also offer some great long-term growth opportunities.
Threats do not pose any immediate danger to Samsung. The company is well prepared to eliminate all the threats and/or protect against the damage they can do.
In my opinion, Samsung will experience solid growth in the future due to the company’s ability to introduce innovative quality products that have strong demand from consumers all over the world.
Sources:
- Samsung Electronics (2018). Annual Report. Available at: http://images.samsung.com/is/content/samsung/p5/global/ir/docs/2017_con_quarter04_all.pdf Accessed September 17, 2018
- Apple, Inc. (2017). Form 10-K for the Fiscal Year Ended September 30, 2017. Available at: http://files.shareholder.com/downloads/AAPL/2456063358x8143945x913905/66363059-7FB6-4710-B4A5-7ABFA14CF5E6/10-K_2016_9.24.2016_-_as_filed.pdf Accessed September 17, 2018
- Microsoft (2018). 2017 Annual Report. Available at: https://www.microsoft.com/investor/reports/ar17/index.html Accessed September 17, 2018
- Intel (2018). Annual Report 2017. Available at: http://s22.q4cdn.com/548661872/files/doc_downloads/Intel_Annual_Report_Final-3.20.pdf Accessed September 17, 2018
- Amazon.com (2018). Form 10-K for the Fiscal Year Ended December 31, 2017. Available at: http://phx.corporate-ir.net/phoenix.zhtml?c=97664&p=irol-sec Accessed September 17, 2018
- LG Electronics (2018). Consolidated Financial Statements December 31, 2017 and 2016. Available at: http://www.lg.com/global/investor-relations/reports Accessed September 17, 2018
- U.S. Patent and Trademark Office (2016). Patenting by Organizations 2015. Available at: http://www.uspto.gov/web/offices/ac/ido/oeip/taf/topo_15.htm Accessed September 17, 2018
- U.S. Patent and Trademark Office (2017). Patenting by Organizations 2015. Available at: https://www.uspto.gov/web/offices/ac/ido/oeip/taf/reports.htm Accessed September 17, 2018
- U.S. Patent and Trademark Office (2018). Patenting by Organizations 2016. Available at: https://www.uspto.gov/web/offices/ac/ido/oeip/taf/reports.htm Accessed September 17, 2018
- Statista (2018). Global market share held by LCD TV manufacturers from 2008 to 2017. Available at: http://www.statista.com/statistics/267095/global-market-share-of-lcd-tv-manufacturers/ Accessed September 17, 2018
- Statista (2018). Global market share held by NAND Flash memory manufacturers worldwide from 2010 to 2017. Available at: http://www.statista.com/statistics/275886/market-share-held-by-leading-nand-flash-memory-manufacturers-worldwide Accessed September 17, 2018
- IDC (2018). Apple Passes Samsung to Capture the Top Position in the Worldwide Smartphone Market While Overall Shipments Decline 6.3% in the Fourth Quarter, According to IDC. Available at: https://www.idc.com/getdoc.jsp?containerId=prUS43548018 Accessed September 17, 2018
- Interbrand (2018). Best Global Brands 2017. Available at: http://interbrand.com/best-brands/best-global-brands/2017/ranking/ Accessed September 17, 2018
- Forbes (2018). The World’s Most Valuable Brands. Available at: https://www.forbes.com/powerful-brands/list Accessed September 17, 2018
- Interbrand (2001). Best Global Brands 2000. Available at: http://interbrand.com/best-brands/best-global-brands/2000/ranking/ Accessed September 17, 2018
- Interbrand (2006). Best Global Brands 2005. Available at: http://interbrand.com/best-brands/best-global-brands/2005/ranking/ Accessed September 17, 2018
- Interbrand (2011). Best Global Brands 2010. Available at: http://interbrand.com/best-brands/best-global-brands/2010/ranking/ Accessed September 17, 2018
- Interbrand (2016). Best Global Brands 2015. Available at: http://interbrand.com/best-brands/best-global-brands/2015/ranking/ Accessed September 17, 2018
- Samsung (2017). Samsung Honored for Outstanding Design and Engineering with 36 CES 2018 Innovation Awards. Available at: https://news.samsung.com/global/samsung-honored-for-outstanding-design-and-engineering-with-36-ces-2018-innovation-awards Accessed September 17, 2018
- Samsung (2017). IDEA Design Awards 2017. Available at: http://design.samsung.com/global/contents/news/index.jsp?id=16 Accessed September 17, 2018
- IDSA (2018). IDEA Gallery. Available at: http://www.idsa.org/awards/idea/gallery Accessed September 17, 2018
- Samsung (2018). Samsung Recognized for EPA Green Power Leadership. Available at: https://news.samsung.com/us/2018-samsung-epa-green-power-leadership/ Accessed September 17, 2018
- Ogura, K. (2016). Samsung’s leaner, faster approach to smartphones pays off. Available at: http://asia.nikkei.com/magazine/20160505-DEMOCRACY-DEFERRED/Business/Samsung-s-leaner-faster-approach-to-smartphones-pays-off Accessed September 17, 2018
- GSM Arena (2018). Samsung Phones. Available at: http://www.gsmarena.com/samsung-phones-9.php Accessed September 17, 2018
- IDC (2018). Smartphone Vendor. Available at: https://www.idc.com/promo/smartphone-market-share/vendor Accessed September 17, 2018
- Gartner (2018). Internet of Things. Available at: http://www.gartner.com/it-glossary/internet-of-things/ Accessed September 17, 2018
- Statista (2018). Internet of Things (IoT) connected devices installed base worldwide from 2015 to 2025 (in billions). Available at: https://www.statista.com/statistics/471264/iot-number-of-connected-devices-worldwide/ Accessed September 17, 2018
- Markets and Markets (2017). Internet of Things (IoT) Market by Software Solution, Service, Platform, Application Area, and Region – Global Forecast to 2022. Available at: http://www.marketsandmarkets.com/Market-Reports/internet-of-things-market-573.html Accessed September 17, 2018
- Technavio (2017). Global Wireless Chipset Market 2017-2021. Available at: https://www.technavio.com/report/global-semiconductor-equipment-global-wireless-chipset-market Accessed September 17, 2018
- Markets and Markets (2017). Wi-Fi Chipset Market by IEEE Standards, Band, MIMO Configuration, Product Category, and Geography – Global Forecast to 2022. Available at: http://www.marketsandmarkets.com/Market-Reports/wi-fi-chipset-market-42186393.html Accessed September 17, 2018
- Research and Markets (2018). Augmented Reality and Virtual Reality Market by Offering, Device Type, Application, and Geography – Global Forecast to 2023. Available at: https://www.researchandmarkets.com/research/dm5djr/augmented_reality?w=4 Accessed September 17, 2018
- Markets and Markets (2017). Intelligent Virtual Assistant Market – Global Forecast to 2023. Available at: https://www.marketsandmarkets.com/Market-Reports/intelligent-virtual-assistant-market-184337393.html Accessed September 17, 2018
- IDC (2018). Smartphone OS. Available at: http://www.idc.com/promo/smartphone-market-share/os Accessed September 17, 2018
- Statista (2018). Global smartphone shipments forecast from 2010 to 2021 (in million units). Available at: http://www.statista.com/statistics/263441/global-smartphone-shipments-forecast/ Accessed September 17, 2018