This PepsiCo SWOT analysis reveals how the second largest food company in the world uses its competitive advantages to dominate snack and beverage industries.
It identifies all the key strengths, weaknesses, opportunities and threats that affect the company the most. If you want to find out more about the SWOT of PepsiCo, you’re in the right place.
For more information on how to do a SWOT analysis please refer to our article.
Keep reading.
Company Overview
| Name | PepsiCo Inc. |
|---|---|
| Founded | August 28, 1898 |
| Logo |  |
| Industries served | Beverage (Pepsi, Mountain Dew, Gatorade, Sierra Mist) Food (Quaker Oats, WBD, Rold Gold) Snack (Lay’s, Doritos, Cheetos) |
| Geographic areas served | Worldwide (more than 200 countries) |
| Headquarters | Purchase, New York, U.S. |
| Current CEO | Ramon Laguarta |
| Revenue (US$) | $91.854 billion (2024) |
| Net Income (US$) | $9.578 billion (2024) |
| Employees | 319,000 (2023) |
| Main Competitors | The Coca-Cola Company, DPSG, Mondelēz International, Monster Beverage Corporation, Hansen Natural Corporation, National Beverage Corp., Kraft Foods Group, The Kellogg Company, ConAgra Foods., Nestlé S.A., Snyder’s-Lance and other beverage, food and snack companies. |
PepsiCo business overview from the company’s financial report:
“We are a leading global food and beverage company with a complementary portfolio of enjoyable brands, including Frito-Lay, Gatorade, Pepsi-Cola, Quaker and Tropicana.
Through our operations, authorized bottlers, contract manufacturers and other third parties, we make, market, distribute and sell a wide variety of convenient and enjoyable beverages, foods and snacks, serving customers and consumers in more than 200 countries and territories.
Performance with Purpose is our goal to deliver sustained value by providing a wide range of beverages, foods and snacks, from treats to healthy eats; finding innovative ways to minimize our impact on the environment and lower our costs through energy and water conservation as well as reduce our use of packaging material; providing a safe and inclusive workplace for our employees globally; and respecting, supporting and investing in the local communities in which we operate.
In 2017, sales to Walmart Stores, Inc., including Sam’s Club (Sam’s), represented approximately 13% of our total net revenue. Our top five retail customers represented approximately 37% of our 2017 net revenue in North America, with Walmart (including Sam’s) representing approximately 19%.
In many countries in which our products are sold, including the United States, The Coca-Cola Company is our primary beverage competitor.
Other beverage, food and snack competitors include, but are not limited to, DPSG, Kellogg Company, The Kraft Heinz Company, Mondelez International, Inc., Monster Beverage Corporation, Nestlé S.A., Red Bull GmbH and Snyder’s-Lance, Inc.
Many of our food and snack products hold significant leadership positions in the food and snack industry in the United States and worldwide. In 2017, we and The Coca-Cola Company represented approximately 23% and 20%, respectively, of the U.S. liquid refreshment beverage category by estimated retail sales in measured channels.”[1]
You can find more information about the business in PepsiCo’s official website or Wikipedia’s article.
PepsiCo SWOT analysis
| Strengths | Weaknesses |
|---|---|
| 1. Comprehensive product portfolio with 100 brands serving nearly every niche in the beverage, food and snack industries 2. Brand recognition and reputation 3. Focus on innovation and customer- oriented products 4. One of the largest and the most efficiently used advertising budgets among beverage and food companies 5. Strong distribution network, which enables partnerships with some of the largest beverage brands | 1. Overdependence on income from Walmart stores and other retailers 2. Overdependence on sales from the U.S. market |
| Opportunities | Threats |
|---|---|
| 1. Growing tequila market with many smaller brands that can be easily acquired 2. Expansion of ready-to-drink coffee market in the U.S. 3. Coconut water market is expected to reach US$8.3 billion by 2023 4. China’s savory snack market will be worth US$16.6 billion by 2021 5. The declining U.S. dollar exchange rate could positively affect the company’s revenue and profits | 1. Concerns over obesity and potentially dangerous substances may reduce demand for some of the company’s products 2. Poor quality water and its scarcity could negatively impact PepsiCo’s production costs and capacity 3. Increased competition in beverage, food and snack industries could hurt PepsiCo’s business 4. Extension of ‘soda tax’ to more cities or states in the U.S. |
Strengths
1. Comprehensive product portfolio with 100 brands serving nearly every niche in the beverage, food and snack industries.
Commencing operations in 1965, PepsiCo has become the second largest food and beverage company in the world today.
The company earned US$63.525 billion in 2017, second only to Nestlé S.A. PepsiCo was able to achieve this via strengthening its product portfolio and offering as many different beverages and foods as possible.
The company sells nearly 100 different brands, of which 22 have each generated more than US$1 billion dollars in 2017.[1] In addition, more than 10 brands have generated between US$500 million and US$1 billion in revenue.
Figure 1. Brand portfolio by world’s largest food and beverage companies
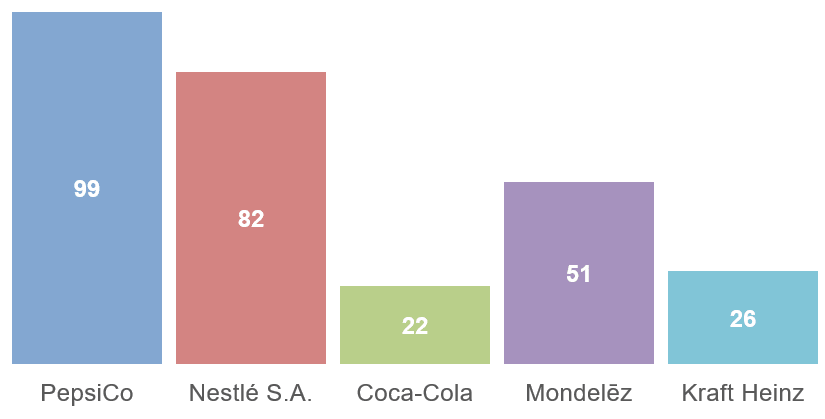
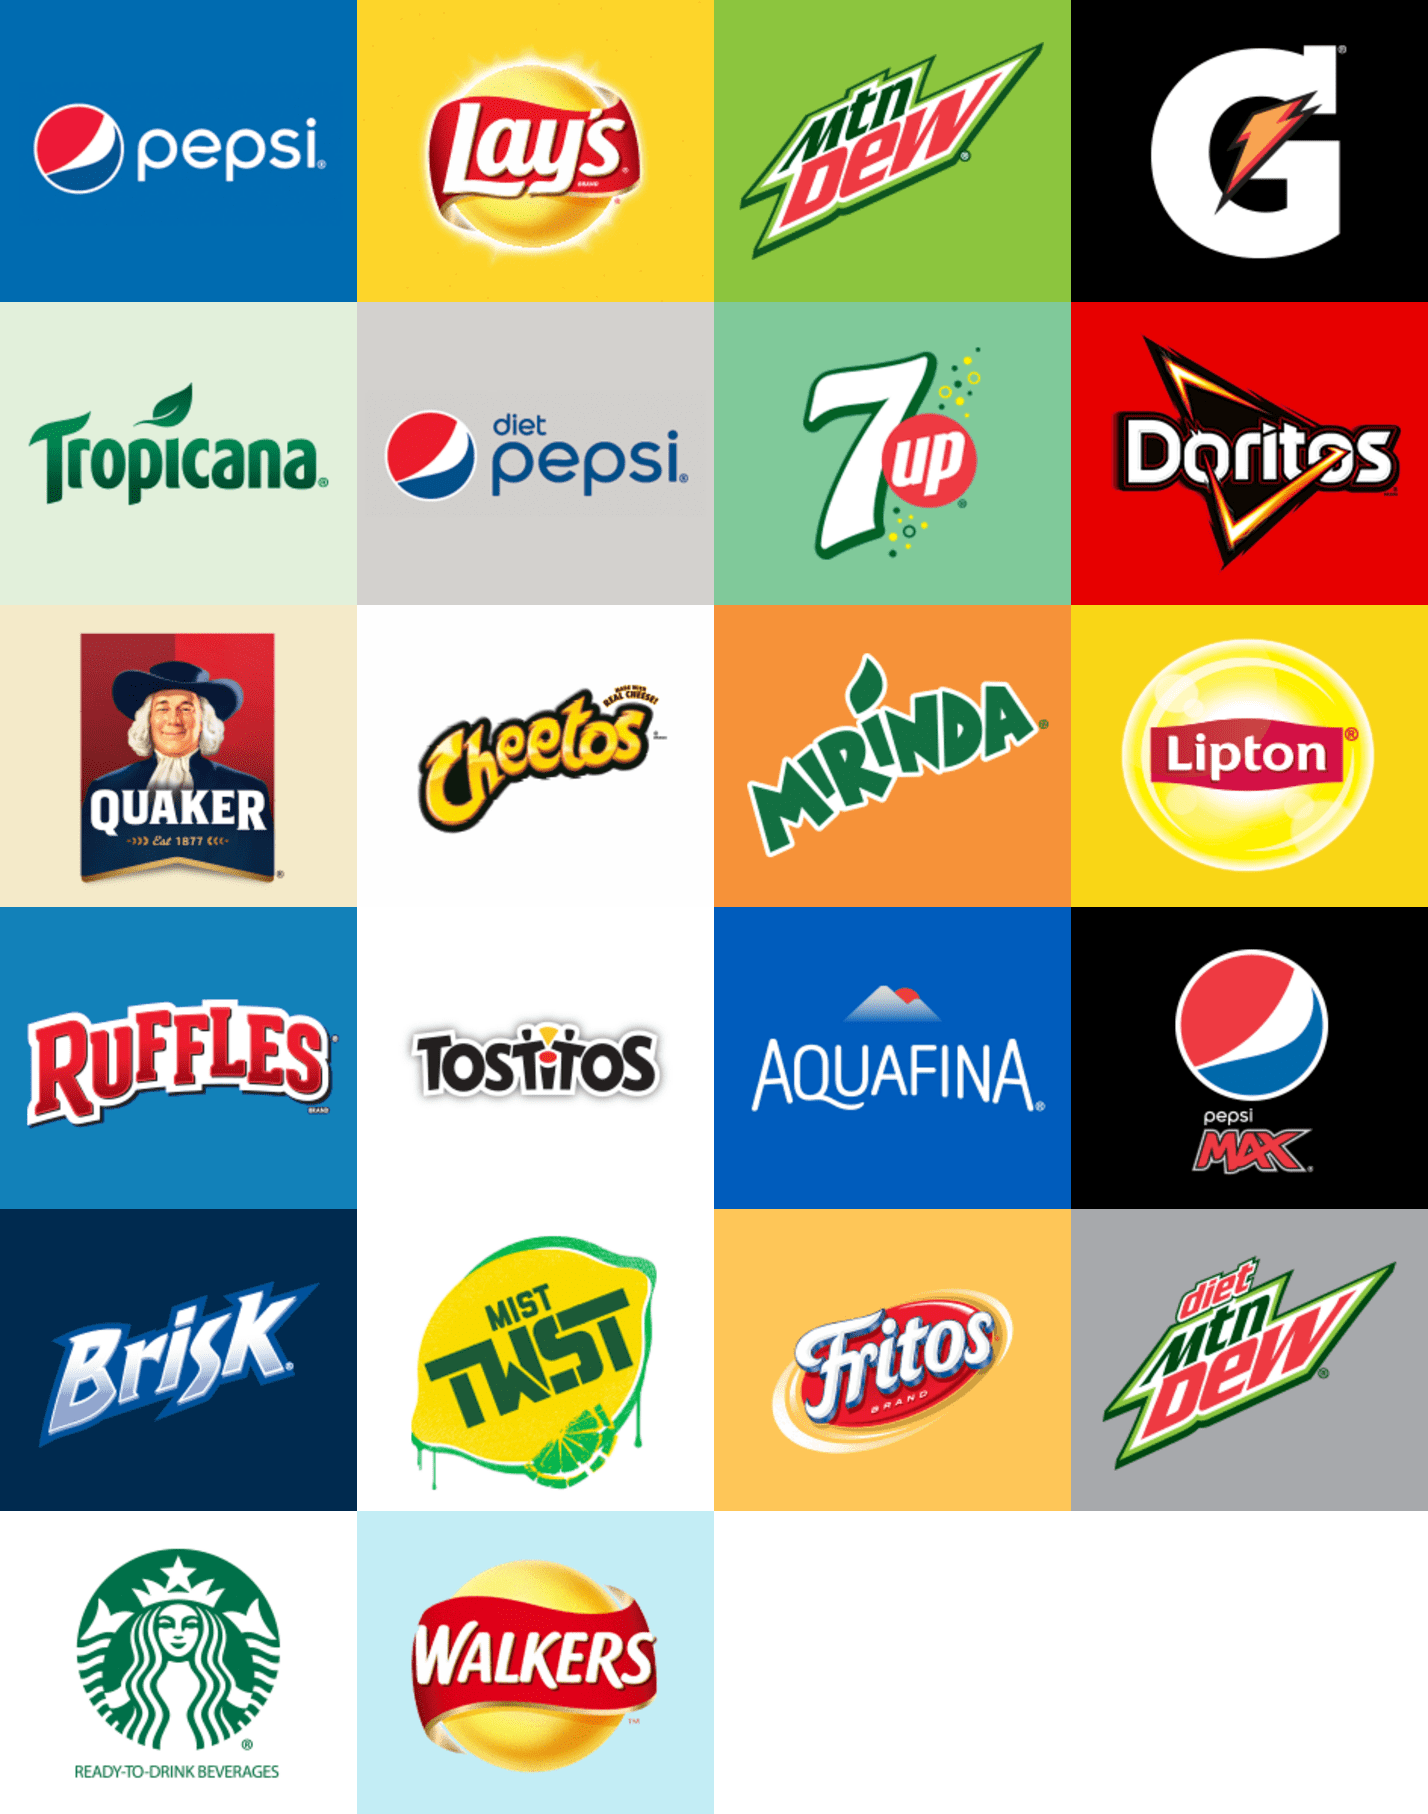
Figure 2. PepsiCo’s top earning brands
PepsiCo’s brand portfolio is highly diversified. No competitor has as many high earning brands as PepsiCo. They each rely on a few main products to earn the majority of their revenue. This makes them very vulnerable to any changes in their core products’ markets.
PepsiCo is better equipped to satisfy the needs of its customers with its wide variety of successful products. The company offers nearly every type beverage or snack and its brands can often be substituted for each other.
For example, Lays can be replaced with Doritos, Cheetos, Ruffles, Tostitos or Fritos, so if one product doesn’t satisfy a consumer’s needs, PepsiCo can offer many more choices. Therefore, changes in customer tastes do not affect the company as severely as they would other companies.
2. Brand recognition and reputation
PepsiCo owns and markets some of the most recognizable global brands, including Pepsi, Tropicana, Gatorade, Mountain Dew, Aquafina, Lay’s, Doritos, Cheetos and many other popular brands.
According to Interbrand[7] and Forbes[8], the Pepsi brand is the 22nd and 30th most valuable brand in the world, worth US$20.491 billion and US$18.2 billion, respectively. Forbes also identified Frito-Lay as the 40th most valuable brand in the world, worth US$13.6 billion.
Except for Coca-Cola and Sprite, no other non-alcoholic beverage brand besides Pepsi has been recognized as being one of the top 100 most valuable brands in the world.
According to IRI data, which measured the most popular U.S. snack brands in the first half of 2017, 8 of the 10 most popular snack brands were owned by PepsiCo.[9]
Figure 3. Top 10 best-selling U.S. snack brands
| Ranking | Brand | Owner |
|---|---|---|
| 1. | Lay’s | owned by PepsiCo |
| 2. | Doritos | owned by PepsiCo |
| 3. | Cheetos | owned by PepsiCo |
| 4. | Ruffles | owned by PepsiCo |
| 5. | Pringles | – |
| 6. | Tostitos | owned by PepsiCo |
| 7. | Wavy Lays | owned by PepsiCo |
| 8. | Fritos | owned by PepsiCo |
| 9. | Tostitos Scoops | owned by PepsiCo |
| 10. | Snyder’s of Hanover | – |
The company sells its products in more than 200 countries, so consumers are aware of PepsiCo’s brands all over the world. Owning and selling popular brands also helps PepsiCo to cross-sell its other brands or introduce new products to the market much more easily.
3. Focus on innovation and customer-oriented products
PepsiCo has been operating for 117 years. A company can only survive for so long if it focuses on innovation and its customers. Innovation has helped PepsiCo to introduce many popular brands to create its strong product portfolio. Usually, the more a company spends on innovation the faster it grows. Research and development (R&D) spending by PepsiCo is one of the highest among all the food and beverage companies. The company has spent US$737 million or 1.2% of its revenue on R&D in 2017, a growth of over 40% since 2011.[1]
Figure 4. R&D spending by the largest food and beverage companies (R&D and revenue in US$ billions)
| / | 2015 | 2016 | 2017 | Revenue | % of revenue |
|---|---|---|---|---|---|
| PepsiCo | 0.754 | 0.760 | 0.737 | 63.525 | 1.2 |
| Nestlé S.A.* | 1.678 | 1.736 | 1.724 | 89.791 | 1.9 |
| Mondelēz | 0.409 | 0.376 | 0.366 | 25.896 | 1.4 |
| Coca-Cola | – | – | – | 35.410 | – |
To strengthen its innovation capabilities, PepsiCo currently runs research centers in 9 countries, including Brazil, China, Germany, India, Mexico, Russia, the United Arab Emirates, the United States and the United Kingdom. The company’s research centers use their knowledge of nutrition science, food science and engineering, as well as consumer insights to develop new nutritious products that meet market trends.[1]
Over the past few years, the company introduced many new products to the market, including Trop 50, LIFEWTR, Probiotics, Propel Electrolyte Water, Lipton Sparkling Tea (in partnership with Unilever), Naked Juice smoothies, new varieties of Tropicana Farmstand juice, Pepsi Limón and Bubbly.[13] These were just for the beverage market. PepsiCo also made many new additions to its snack portfolio. Most of the products were introduced as a result of consumer requests for healthier, lower calorie and less sugar-containing beverages and snacks.
PepsiCo’s R&D spending and the insights it has gathered from consumers is paying off. The company’s 2017 results show 2% revenue growth in its Frito-Lay North America division, 6% revenue growth in its Latin America division and 8% growth in ESSA (European Sub-Saharan Africa) division.
In 2006, only 38% of PepsiCo brands belonged to ‘Better For You’ and ‘Good For You’ brand categories, which included healthier food and beverage options offered by the company. PepsiCo’s continuous expenditure in R&D and a few successful acquisitions helped the company to increase its ‘Better For You & Good For You’ brand portfolio to 50% in 2017.
Few of PepsiCo’s competitors are able to invest in R&D so successfully.
4. One of the largest and the most efficiently used advertising budgets among food and beverage companies
In 2017, PepsiCo spent US$2.4 billion on advertising, the 2nd largest amount among its competitors. The company’s large advertising budget provides PepsiCo with the following competitive advantages:
- it helps in introducing new products to the market;
- it promotes the brand;
- it informs consumers about product features;
- it communicates the brand’s message to the public;
- it increases sales.
Figure 5. Advertising budgets by major food and beverage companies (in $US billions)
| Company | 2015 | 2016 | 2017 | % of revenue |
|---|---|---|---|---|
| PepsiCo | 2.4 | 2.5 | 2.4 | 3.8% |
| The Coca-Cola Company | 3.976 | 4.004 | 3.976 | 11.2% |
| Mondelēz International | 1.542 | 1.396 | 1.248 | 4.8% |
| Dr Pepper Snapple Group (DPSG) | 0.473 | 0.477 | 0.547 | 8.2% |
While, PepsiCo’s advertising budget is not the largest among its competitors it’s certainly used the most efficiently. In 2017, the company spent only 3.8% of its revenue on advertising, much lower than The Coca-Cola Company, Mondelēz International or DPSG.
PepsiCo is focusing its advertising efforts on digital advertising for maximum results. The company relies heavily on Facebook, Twitter, Instagram and other digital channels to interact with consumers, produce compelling content, drive engagement and build brand equity.
The company has won over 10 various marketing and advertising awards and accolades in 2016 and 2017.[15] PepsiCo’s Mountain Dew brand was named the ‘Reader’s Choice Hottest Digital Marketer of the Year’. PepsiCo was awarded ‘Marketer of the Year’ in Latin America. PepsiCo’s Doritos, Gatorade, Naked Juice and Quaker marketing and advertising campaigns also won various awards.
PepsiCo’s efficient spending on advertising and its focus on digital advertising channels is a strength few companies can match.
5. Strong distribution network, which enables partnerships with some of the largest beverage brands
PepsiCo sells its products in more than 200 countries. To distribute its products in so many countries the company uses an extensive distribution network. Depending on customer needs, product characteristics and local trade practices, PepsiCo uses the following distribution systems:
- direct-store-delivery
- customer warehouse
- distributor networks.
These distribution systems allow the company to reach nearly every potential consumer in the world.[1] This is one of the main reasons why both Unilever and Starbucks have entered into partnerships with PepsiCo to market and sell their products using PepsiCo’s distribution network.
In 1991, Unilever created their first joint venture with PepsiCo, the Pepsi Lipton Partnership, which sells and markets Lipton ready-to-drink (RTD) tea.[16] The partnership has proven to be very successful, with Lipton RTD teas now being worth over US$3 billion in revenue for PepsiCo.[1]
In 1994, Starbucks entered into a joint venture with PepsiCo to market RTD coffee under the North American Coffee Partnership. By 2017, this Starbucks RTD coffee business was worth US$2 billion to PepsiCo, and this joint venture partnership has just announced additional expansion plans into new overseas markets, which will further increase revenue for PepsiCo and strengthen its partnership with Starbucks.[17]
Few other companies can match the strength of PepsiCo’s distribution network and its ability to benefit from these partnerships.
Weaknesses
1. Overdependence on sales to Walmart and other retailers
In 2017, sales to Walmart Inc., including Sam’s Club (Sam’s), represented approximately US$8.3 billion, or 13% of PepsiCo’s total net revenue. Another five retail customers represented approximately 33% of the company’s 2017 North American (United States and Canada) net revenue, with Walmart (including Sam’s) representing approximately 18%.
Figure 6. PepsiCo US$ dollar sales to Walmart and the corresponding percentage of total PepsiCo revenue
| / | 2013 | 2014 | 2015 | 2016 | 2017 |
|---|---|---|---|---|---|
| Sales | 7.3 billion | 8 billion | 8.2 billion | 8.2 billion | 8.3 billion |
| % of total | 11% | 12% | 13% | 13% | 13% |
Walmart is the single largest customer of PepsiCo. An example of Coca-Cola’s partnership with McDonald’s proves that such a reliance on sales from one customer can have a significant impact on a company’s performance. If Walmart’s retail market share happens to drop by only 5%, PepsiCo would lose at least US$415 million. Therefore, an overdependence on its sales to one customer (i.e. Walmart) is a major current PepsiCo weakness.
2. Overdependence on sales from the U.S. market
PepsiCo distributes its products in more than 200 countries, however its main market is the U.S. The company’s revenue from its U.S. operations were US$36.546 billion, US$36.732 billion and US$35.266 billion for the respective fiscal years of 2017, 2016 and 2015.[1] In 2017, 57.5% of PepsiCo’s entire revenue and more than 60% of its operating income came from the U.S.
Figure 7. PepsiCo revenue breakdown by country
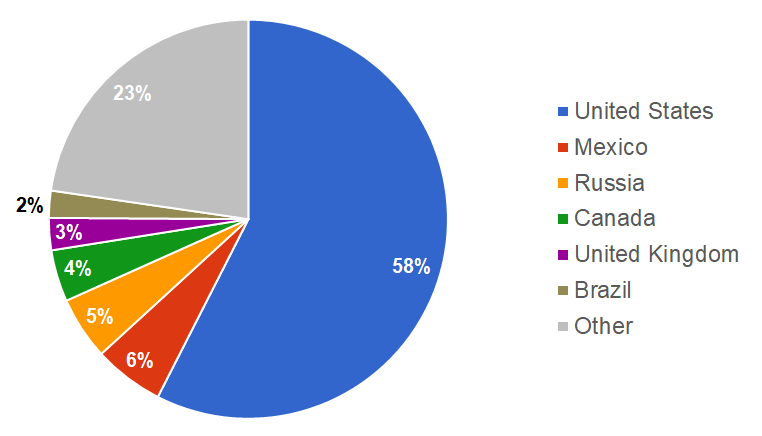
PepsiCo is the only company among its top competitors that receives more than half of its revenue from one country (the U.S.). Its competitors have much more geographically diversified revenue streams. Therefore, they are less likely to be affected by major market changes in any one country.
Figure 8. Revenue and percentages of sales in the U.S for major food and beverage companies (in US$ billions)
| / | Revenue | Revenue from U.S. | % of revenue |
|---|---|---|---|
| PepsiCo | 63.525 | 36.546 | 57.5% |
| Nestlé S.A.* | 89.791 | 26.687 | 29.7% |
| Mondelēz International | 25.896 | 6.275 | 24.2% |
| The Coca-Cola Company | 35.410 | 14.727 | 41.6% |
PepsiCo’s reliance on sales from the U.S. market potentially weakens the company, as decreasing demand for carbonated drinks in the U.S., may seriously affect the company’s future growth prospects.[18] Therefore, in order to grow its beverage business, the company will have to find other growth markets.
Opportunities
1. Growing tequila market with many smaller brands that can be easily acquired
PepsiCo is one of the largest beverage companies in the world. Only The Coca-Cola Company and Nestle are earning more from beverage sales than PepsiCo. The company operates in almost every non-alcoholic beverage segment and faces strong competition in each product category. There is little room for Pepsi to grow its beverage business and do it fast.
Another growing opportunity for the company is to venture into an alcohol industry. An alcohol industry grew by 1.7% in the U.S. in 2017.[19] It was an eighth consecutive year of growth in the market. The market is worth around US$80 billion in the U.S. alone. An alcohol market is huge with many different segments in the market, including:
- Malts (beer, cider);
- Wines (table wines, champagne, sparkling wines);
- Spirits (vodka, whisky, rum, tequila, brandy, gin).
Currently, one of the fastest growing alcohol industry’s segment is tequila. Tequila sales grew by 9.9% in 2017 [20] to US$2.7 billion. The market for tequila is expected to be worth US$8 billion in the Americas (including North and South America) by 2021. [21] There are many smaller brands in the market that could be acquired easily.
Figure 9. Top-selling tequila brands in the U.S. in 2017
| Rank | Brand | Volume sold (in millions of cases) |
|---|---|---|
| 1. | Jose Cuervo | 3.515 |
| 2. | Patron | 2.475 |
| 3. | Sauza | 2.247 |
| 4. | 1800 | 1.090 |
| 5. | Familia Camerena | 0.785 |
| 6. | Juarez | 0.695 |
| 7. | Montezuma Tequila | 0.630 |
| 8. | El Jimador | 0.516 |
| 9. | Don Julio | 0.357 |
| 10. | Margaritaville | 0.305 |
PepsiCo could expand its product offerings by venturing into the alcoholic beverages market. By leveraging its expertise in producing and selling beverages the company could easily increase its revenue and diversify its portfolio.
2. Expansion of the ready-to-drink coffee market in the U.S.
According to the Beverage Marketing Corporation Report, the fastest growing liquid beverage segment in the U.S. during 2013-2017 was RTD coffees.[23][24][25] In 2017, RTD coffees was the fastest growing beverage segment in the U.S. beverage industry, growing by an impressive 12.3%.[18] The RTD coffee segment grew 6 times faster than the entire U.S. liquid beverage market, which grew by 2.1% only in 2017.
Figure 10. RTD coffee growth compared to the growth of the whole liquid beverage market in the U.S.

While, the beverage industry as a whole grew only by 11.3%, RTD coffees grew by a staggering 70.7% over the last 5 years.
Currently, PepsiCo sells RTD coffees using the Starbucks brand under its North American Coffee Partnership. RTD coffee sales generated around US$2 billion in sales for Starbucks and PepsiCo in 2017. If the agreement between PepsiCo and Starbucks does not prohibit it, PepsiCo could introduce its own brand of RTD coffees. The knowledge gained from its experience in marketing and selling Starbucks coffee could potentially help PepsiCo gain further market share in the RTD coffee segment.
3. Coconut water market is expected to reach US$8.3 billion by 2023
Consumer trend for healthy beverages have pushed the water market growth to the new levels. According to Beverage Marketing Corporation, [26] volume sales of bottled water grew by 7% in 2017. This allowed water to become the most popular beverage category in the U.S. for the second consecutive year.[26] One of the subcategories that pushed the bottled water to the No.1 spot in the beverages was a growing demand for plant-based waters, mostly coconut water.
Consumers, who are looking for the alternatives to healthy hydration often choose plant based waters, which offer better flavor, natural ingredients and less sugar. Plant-based water market is dominated by coconut water, which is experiencing a significant growth both globally and in the U.S. By various estimates, coconut water market is expected to grow from US$2.4 to US$8.3 billion globally by 2023.[27][28]
PepsiCo currently owns O.N.E. coconut water brand, which is the third largest brand in coconut water market.[29] PepsiCo is also in negotiations to acquire Vita Coco a leading coconut water brand.
By increasing the market share of its own O.N.E. brand and the acquisition of Vita Coco, PepsiCo would dominate coconut water market, which has the potential to become a very significant market in 5-10 years.
4. China’s savory snack market will be worth US$16.6 billion by 2021
China with its 1.3 billion population is one of the largest beverage and food markets in the world. Nonetheless, China accounts for less than 2% of PepsiCo’s total revenue.
In China, one of the fastest growing food markets will be savory snacks. According to Euromonitor report,[30] China’s savory snack market will be worth around US$16.6 billion by 2021. The market is expected to grow on average by 4% from 2017 to 2021.
PepsiCo, which is the largest snack vendor in the world, has only 5.1% market share in China’s savory snack market. The company is behind Taiwan based company Want Want, which has 9.9% market share.
PepsiCo could introduce new savory snacks to the market, increase marketing and advertising spending and enter into new joint ventures with local Chinese companies in order to grow its market share in Chinese savory snack market.
5. The declining U.S. dollar exchange rate could positively affect the company’s revenue and profits
Currency exchange rates affect every multinational company, including PepsiCo. In 2017, the company earned US$26.979 billion or 42.5% of its revenue outside of the U.S.[1]
Figure 11. PepsiCo geographic revenue breakdown
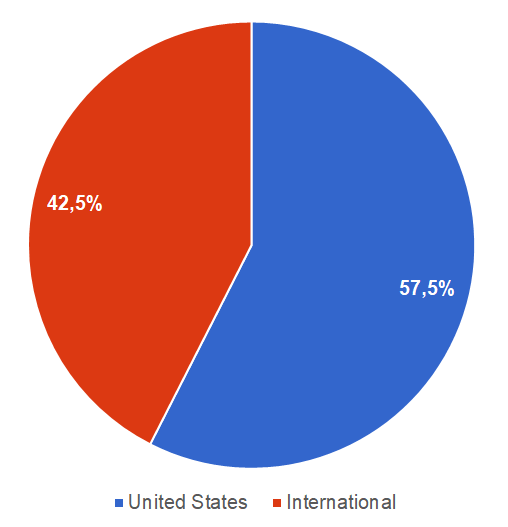
This means that PepsiCo currently receives a large share of its profits in currencies other than the U.S. dollar. Other currencies therefore have to be converted to the U.S. dollar in order for the company to be able to calculate its total revenue and transfer its profits back to the U.S. This is where a weak U.S. dollar, or in other words, the currently declining U.S. dollar exchange rate is a financial opportunity for the company.
A weak dollar does not only increase the profits from foreign countries but also makes the company’s products cheaper and more attractive to the customers abroad. It also provides an opportunity for PepsiCo to expand its sales outside of the U.S. and diversify its geographic revenue.
In 2017, the U.S. dollar declined in value against other currencies for the first time in 5 years. Current forecasts indicate that the U.S. dollar exchange rate is going to continue to decline against other currencies in 2018 as well. This means that PepsiCo products will become even cheaper abroad and its revenue and profits from outside the country are likely to increase when converted to U.S. dollars.
Threats
1. Concerns over obesity and potentially dangerous substances may reduce the demand for some of the company’s products
PepsiCo has already attempted to meet the consumer trend towards demanding healthier foods and beverages. It has transformed its product portfolio to include healthier options like juices, vitamin water and healthy snacks. Nonetheless, the company is still largely dependent on the sales of food and beverages that are both rich in calories and which may contain many substances that are perceived by the public as damaging to their health.[1] PepsiCo emphasizes this threat in its financial report:
“Demand for our products depends in part on our ability to anticipate and effectively respond to shifts in consumer trends and preferences, including increased demand for products that meet the needs of consumers who are concerned with health and wellness (including products that have less sodium, added sugars and saturated fat);
Consumer concerns or perceptions regarding the nutrition profile of certain of our products, including their caloric content, or perceptions (whether or not valid) regarding the health effects of ingredients or substances present in certain of our products, such as 4-MeI, acrylamide, artificial sweeteners, caffeine, high-fructose corn syrup, saturated fat, sodium, sugar, trans fats or other product ingredients, substances or attributes, including genetically modified ingredients.”[1]
PepsiCo’s sales and reputation will suffer if the company isn’t able to properly respond to changing consumer tastes and their potential concerns over harmful ingredients in their foods and beverages.
2. Poor quality water and its scarcity could negatively impact PepsiCo’s production costs and capacity
Beverages make half of PepsiCo’s sales and water is used in all of its beverage products. Water is scarce and is becoming even more scarce due to factors such as climate change, growing populations, overexploitation or resources, the increasing demand for food products, increasing pollution and the poor management of waste water.
Demand for water is increasing, and it will likely become more difficult for PepsiCo to access both clean and inexpensive supplies of drinking water, resulting in potentially increased production costs and therefore lower profitability.
The company also currently receives lots of criticism and negative publicity over its high use of drinking water near communities. In the future, water scarcity will likely become a more significant problem that will negatively impact company’s operations.[1]
3. Increased competition in the beverage, food and snack industries could adversely affect PepsiCo’s business
According to PepsiCo’s financial report, competitive rivalry is one of the key threats affecting the company. The beverage, food and snack industries are highly competitive and consist of numerous small, large and multinational companies. Beverage, food and snack products compete primarily on the basis of brand recognition, taste, price, quality, product variety, distribution, advertising, packaging, convenience, service, marketing and promotional activity, as well as the ability to anticipate and respond to consumer trends.[1]
The rivalry in the beverage industry intensifies significantly every year. The market for carbonated soft drinks is shrinking each year[18] with the same number of competitors. This means that PepsiCo’s largest rivals, including The Coca-Cola Company and DPSG, have to compete for an even smaller market share each year.
In addition, the fastest growing beverage industry segments, such as RTD coffees, RTD teas, energy drinks and bottled water, are experiencing an increasing number of new market entrants. However, PepsiCo at this stage doesn’t even have its own brands to offer consumers in these RTD coffee and RTD tea markets. The longer PepsiCo waits, the harder it will become to establish itself in these new growing markets.
4. Extension of ‘soda tax’ to more cities or states in the U.S.
In 2015, Berkeley was the first U.S. city to pass the sugar-sweetened beverage tax. [31] The tax, which applies to all the beverages containing sugar is aimed at reducing the demand for pricier sweetened beverages. The ‘soda tax’ proponents argue that the tax should result in lower obesity rates or at least, people choosing healthier beverage options, such as water.
A few studies were done to research the effect ‘soda tax’ had on people’s buying choices and overall demand. According to the American Journal of Public Health,[32] the demand for sugar-sweetened beverages in Berkeley declined by 21%, while water consumption increased by 63%. Other studies confirmed more or less the same results.[33]
Since, the first sugar-sweetened beverage tax was passed in Berkeley, more cities joined and as of March 2018, the tax is implemented in 6 U.S. cities, with two more cities joining by the end of the year.[31]
Sugar-sweetened beverage tax may heavily affect PepsiCo, which still heavily relies on soft carbonated drinks. If the tax will prove to have positive effects on health, it could gain huge support across the country and more cities and even states may pass it. This would result in hundreds of millions of lost revenues for PepsiCo.
Summary
PepsiCo should continue its current way of doing business and further build upon its strengths. That’s because the strengths like, comprehensive and diversified brand portfolio, focus on innovation and customer-oriented products and strong distribution network, has allowed PepsiCo to grow and become the second largest food and beverage company in the world.
As for the weaknesses, PepsiCo’s overdependence on the U.S. market and especially on Walmart, shouldn’t hurt the company too much in the future.
Most of the opportunities are very well-known for the company. PepsiCo should push into the China’s savory snack market and finally enter the alcoholic beverage market. China’s savory snack market will prove significant growth avenue in the future. PepsiCo could also easily use its current strengths to enter and expand in alcoholic beverage market.
Threats that affect PepsiCo also affect every other major beverage and snack company. Water scarcity will result in fewer clean water resources available and will definitely increase the company’s costs in the future. ‘Soda tax’ will likely be expanded and will further decrease the demand for sweetened sparkling beverages.
PepsiCo has a few challenges in the future, but it still has growth opportunities in terms of new markets, new products or by simply acquiring smaller growing beverage and snack brands.
Sources
- PepsiCo Inc. (2018). 2017 Annual Report. Available at: http://www.pepsico.com/docs/album/investor/pepsico-inc-2017-annual-report.pdf Accessed September 13, 2018
- Nestlé S.A. (2018). Brands A-Z. Available at: http://www.nestle.com/Brands/BrandsSearchList?char=A Accessed September 13, 2018
- The Coca-Cola Company (2018). All Brands. Available at: http://www.coca-colacompany.com/brands/product-description Accessed September 13, 2018
- Mondelēz International (2018). Brand Family. Available at: http://www.mondelezinternational.com/brand-family Accessed September 13, 2018
- The Kraft Heinz Company. (2018). Our Brands. Available at: http://www.kraftheinzcompany.com/brands.html Accessed September 13, 2018
- PepsiCo Inc. (2018). Top Global Brands. Available at: http://www.pepsico.com/Brands/BrandExplorer#top-global-brands Accessed September 13, 2018
- Interbrand (2018). Best Global Brands 2017. Available at: http://interbrand.com/best-brands/best-global-brands/2017/ranking/ Accessed September 13, 2018
- Forbes (2018). The World’s Most Valuable Brands. Available at: http://www.forbes.com/powerful-brands/list/ Accessed September 13, 2018
- Hyslop, G. (2017). Top 10 US salty snack brands in 2017 so far: Sales soar for Frito-Lay’s Ruffles brand. Available at: https://www.bakeryandsnacks.com/Article/2017/07/13/Top-10-US-snack-brands-Sales-soar-for-Frito-Lay-s-Ruffles-brand Accessed September 13, 2018
- Nestlé S.A. (2018). Financial Statements 2017. Available at: https://www.nestle.com/asset-library/documents/library/documents/financial_statements/2017-financial-statements-en.pdf Accessed September 13, 2018
- Mondelēz International, Inc. (2018). Form 10-K for the Fiscal Year Ended December 31, 2017. Available at: https://www.nestle.com/asset-library/documents/library/documents/financial_statements/2017-financial-statements-en.pdf Accessed September 13, 2018
- The Coca-Cola Company (2018). Form 10-K for the Fiscal Year Ended December 31, 2017. Available at: https://www.coca-colacompany.com/content/dam/journey/us/en/private/fileassets/pdf/2018/2017-10K.pdf Accessed September 13, 2018
- PepsiCo (2018). New Products. Available at: http://www.pepsico.com/live/content/topic/New-Products Accessed September 13, 2018
- Dr Pepper Snapple Group, Inc. (2018). Form 10-K for the Fiscal Year Ended December 31, 2017. Available at: http://investor.drpeppersnapplegroup.com/sec-filings?s=127&year=&cat=1 Accessed September 13, 2018
- PepsiCo (2018). Awards and Recognition. Available at: http://www.pepsico.com/About/Awards-and-Recognition Accessed September 13, 2018
- PepsiCo, Inc. (2018). Brief History of PepsiCo’s Beverages. Available at: https://www.pepsicobeveragefacts.com/home/timeline Accessed September 13, 2018
- Starbucks (2018). Fact Sheet: Starbucks and PepsiCo Partnership. Available at: https://news.starbucks.com/facts/fact-sheet-starbucks-and-pepsico-partnership Accessed September 13, 2018
- Beverage Marketing Corporation (2018). Press Release: U.S. Liquid Refreshment Beverage Market Retail Dollars and Volume Both Grew in 2017, Reports Beverage Marketing Corporation. Available at: https://www.beveragemarketing.com/news-detail.asp?id=485 Accessed September 13, 2018
- Beverage Industry (2018). 2018 State of the Beverage Industry: Premium offerings continue to drive wine, spirits markets. Available at: https://www.bevindustry.com/articles/91282-2018-state-of-the-beverage-industry-premium-offerings-continue-to-drive-wine-spirits-markets Accessed September 13, 2018
- Hopkins, A. (2018). ‘Banner year’ for US spirits sales in 2017. Available at: https://www.thespiritsbusiness.com/2018/02/banner-year-for-us-spirits-sales-in-2017/ Accessed September 13, 2018
- Business Wire (2017). Global Tequila Market to Witness Growth Through 2021, Owing to the Introduction of New Flavors: Technavio. Available at: http://www.businesswire.com/news/home/20170309005955/en/Global-Tequila-Market-Witness-Growth-2021-Owing Accessed September 13, 2018
- Statista (2018). Leading brands of tequila in the United States in 2016, based on volume sales (in 1,000 9 liter cases). Available at: https://www.statista.com/statistics/463995/us-leading-brands-of-tequila-volume-sales/ Accessed September 13, 2018
- Beverage Marketing Corporation (2014). Press Release: The U.S. Liquid Refreshment Beverage Market Remained Flat in 2013. Available at: http://www.beveragemarketing.com/news-detail.asp?id=299 Accessed September 13, 2018
- Beverage Marketing Corporation (2015). Press Release: The U.S. Liquid Refreshment Beverage Marketing Enlarged in 2014, Reports Beverage Marketing Corporation. Available at: http://www.beveragemarketing.com/news-detail.asp?id=335 Accessed September 13, 2018
- Beverage Marketing Corporation (2016). Press Release: The U.S. Liquid Refreshment Beverage Market Accelerated in 2015, Reports Beverage Marketing Corporation. Available at: http://www.beveragemarketing.com/news-detail.asp?id=382 Accessed September 13, 2018
- Beverage Marketing Corporation (2018). Press Release: U.S. Liquid Refreshment Beverage Market Retail Dollars and Volume Both Grew in 2017, Reports Beverage Marketing Corporation. Available at: https://www.beveragemarketing.com/news-detail.asp?id=485 Accessed September 13, 2018
- Market Research Engine (2018). Coconut Water Market By Product Type (Coconut water, Natural fruit sugar) and by Regional Analysis – Global Forecast by 2017 – 2024. Available at: https://www.marketresearchengine.com/coconut-water-market Accessed September 13, 2018
- Arizton (2018). Packaged Coconut Water Market – Global Outlook and Forecast 2018-2023. Available at: https://www.arizton.com/market-reports/packaged-coconut-water-market Accessed September 13, 2018
- PepsiCo (2018). About O.N.E. Coconut Water. Available at: https://cu.pepsico.com/one/one-company-info Accessed September 13, 2018
- Douglas, Y. (2017). Savory snacks market in China expected to reach US$16.6 billion 2021, Euromonitor. Available at: http://www.bakeryandsnacks.com/Markets/Savory-snacks-in-China-expected-to-reach-16.6bn-by-2021-Euromonitor Accessed September 13, 2018
- Bird, B. (2018). What Is the Soda Tax and Which Cities Have One? Available at: https://www.thebalance.com/soda-tax-and-which-cities-have-one-4151209 Accessed September 13, 2018
- American Public Health Association (2016). Impact of the Berkeley Excise Tax on Sugar-Sweetened Beverage Consumption. Available at: http://ajph.aphapublications.org/doi/abs/10.2105/AJPH.2016.303362 Accessed September 13, 2018
- Lee, B. Y. (2017). In Berkeley, Soda Tax Is Doing What It’s Supposed To Do. Available at: https://www.forbes.com/sites/brucelee/2017/04/18/in-berkeley-soda-tax-is-doing-what-its-supposed-to-do/#1f771da2cae7 Accessed September 13, 2018