This Ford SWOT analysis reveals how a pioneering automobile company used its competitive advantages to become one of the most innovative automotive manufacturers in the world.
It identifies all the key strengths, weaknesses, opportunities and threats that affect the company the most. If you want to find out more about the SWOT of Ford, you’re in the right place.
For more information on how to do a SWOT analysis please refer to our article.
Company Overview
| Name | Ford Motor Company |
| Founded | June 16, 1903 |
| Industries served | Automotive and Financial Services |
| Geographic areas served | Worldwide (62 countries) |
| Headquarters | Dearborn, Michigan, U.S. |
| Current CEO | Jim Farley |
| Revenue (US$) | $ 184.992 billion (2024) |
| EBITDA (US$) | $ 11.086 billion (2024) |
| Employees | 171,000 (2024) |
| Main competitors | Fiat Chrysler Automobiles, General Motors Company, Honda Motor Company, Hyundai-Kia Automotive Group, PSA Peugeot Citroën, Renault-Nissan B.V., Suzuki Motor Corporation, Toyota Motor Corporation, Volkswagen AG Group and many other automotive companies. |
Business Description
Ford Motor Company business overview from the company’s financial report:
“With about 173,000 employees worldwide, the Company designs, manufactures, markets, and services a full line of Ford cars, trucks, and SUVs, as well as Lincoln luxury vehicles. To expand our business model, we are aggressively pursuing emerging opportunities with investments in electrification, autonomy, and mobility.
In 2022, Ford sold approximately 4,200,000 vehicles at wholesale throughout the world. Substantially, all of our vehicles, parts and accessories are sold through distributors and dealers, the substantial majority of which are independently owned. We do not depend on any single customer or a few customers to the extent that the loss of such customers would have a material adverse effect on our business.
In addition to the products we sell to our dealerships for retail sale, we also sell vehicles to our dealerships for sale to fleet customers, including commercial fleet customers, daily rental car companies, and governments.” [1]
SWOT Analysis
| Strengths | Weaknesses |
|---|---|
| 1. Ford’s F-Series pickup truck line 2. Brand reputation combined with the second most loyal customer base 3. Strong position in China’s automotive market 4. Geographically diversified revenue streams 5. Research and development spending combined with a clear future strategy | 1. Weak brand portfolio 2. Declining market share in the U.S. automotive market 3. Profitability of smaller vehicle models in its product range 4. Below average vehicle recall and dependability rates |
| Opportunities | Threats |
|---|---|
| 1. Future markets for self-driving vehicles 2. Significant untapped potential of Chinese and Indian markets 3. Improving U.S. economic conditions 4. Timing and frequency of new model releases | 1. Increased competition 2. Increased government regulations 3. Economic and political volatility in international markets 4. Rising fuel prices |
Strengths
1. Ford’s F-Series pickup truck line
Ford has produced the best-selling pickup truck in the U.S. market for a record 41 years in a row, via its F-Series pickup trucks (a lifestyle/light commercial vehicle with an enclosed cab and an open rear cargo area with low sides and tailgates).[1] The company’s F-Series pickups outsold nearest competitor in this segment by more than 200,000 vehicles in 2017, taking a 31.8% share of the pickup vehicles market.
Figure 1. Best-selling pickup trucks in the U.S. 2015-2017
| Rank | Brand | 2017 | 2016 | 2015 | 2-year growth |
|---|---|---|---|---|---|
| 1. | Ford F-Series | 896,764 | 820,799 | 780,354 | 14.9% |
| 2. | Chevrolet Silverado | 585,864 | 574,876 | 600,544 | -2.4% |
| 3. | RAM P/U | 500,723 | 489,418 | 451,116 | 11% |
| 4. | GMC Sierra | 217,943 | 221,680 | 224,139 | -2.8% |
| 5. | Toyota Tacoma | 198,124 | 191,631 | 179,562 | 10.3% |
| Total | 2,822,838 | 2,692,540 | 2,543,595 | 11% |
Source: Good Car Bad Car[2]
The company heavily invests in its F-Series product line, owning more than 100 patents related to pickups. Ford renews its F-150 models every few years and expects to introduce its first diesel engine in 2018 as well as enhanced connectivity features. A hybrid F-Series model will be available for sale in 2020. The F-150 is the most profitable and the most successful model for Ford to date, so the company makes every effort to provide the best quality vehicles with the most innovative technologies to assist drivers accordingly.
Why do the F-Series pickups give Ford an edge over its competitors?
- Profitability. Pickups are more profitable vehicles than compact cars or SUVs. In 2015, Nick Bunkley from Auto News[3] calculated that on average Ford was making at least US$10,000 in profit from a single F-150 sold. Considering that Ford sold 896,764 units of these pickups in 2017, Ford’s F-150 profits should have totaled around US$9 billion from these vehicles alone. By making so much profit from one line of vehicles the company can invest more in its other models and subsidize them in order to increase their market share.
- It drives their sales growth in the U.S. The U.S. is the second largest automotive market in the world and is Ford’s main market. The company sold 2,566,000 vehicles in the U.S. in 2017, of which over a third were pickup trucks. However, Ford’s market share in the U.S. declined from 14.9% in 2015 to 14.8% in 2017, despite the significant growth of pickup trucks. The company’s market share in its largest market therefore currently significantly depends on the F-Series’ success.
- Pickup trucks are becoming a status symbol. According to a study done by MaritzCX[4], Ford’s F-150 pickup trucks are the most often purchased vehicle by people earning US$200,000-US$500,000 a year. That’s because pickup trucks are now seen as luxury vehicles, having many of the same features inside as luxury cars. In addition, their style, safety, usefulness and comfort have elevated their status. Ford is the leader in the pickup trucks market in the U.S. and its brand association with such a symbolic vehicle strengthens its overall brand image and reputation.
2. Brand reputation combined with the second most loyal customer base
Ford is the oldest of the three American companies, with its founder Henry Ford being famous for pioneering the revolutionary assembly line technique of mass production in the early 20th century. The company became famous for its mass produced vehicles such as the Model T and the Model A.
Interbrand ranks Ford’s brand as the 33rd most valuable in the world, valuing it at US$13.643 billion.[5] Forbes lists the brand as the 39th most valuable in the world valuing it at US$13.8 billion.[6] Both of these rankings make Ford the most valuable brand among the traditional “big three” American automotive companies – General Motors, Ford and Chrysler.
In the U.S. market, according to a 2015- 2017 analysis of new vehicle registrations, Ford had the second most loyal customer base in the U.S. vehicle market.[7] Ford’s F-Series, Lincoln’s MKC, MKX and MKZ brands were also named in their respective segments as having the most loyal customer base.
However, although Ford has a strong brand reputation globally with a presence in 62 countries, there is room for improvement. Both Forbes and Interbrand currently rank the Ford brand behind its international rivals Toyota, BMW, Mercedes-Benz and Honda.
3. Strong position in China’s automotive market
China is the world’s largest automotive market and Ford’s second largest market in terms of volume. The company currently sells 18.4% of its vehicles there. It isn’t the most profitable market for car manufacturers, but with 28.2 million vehicles sold in 2017, it dwarfs any other vehicle market, including the U.S.
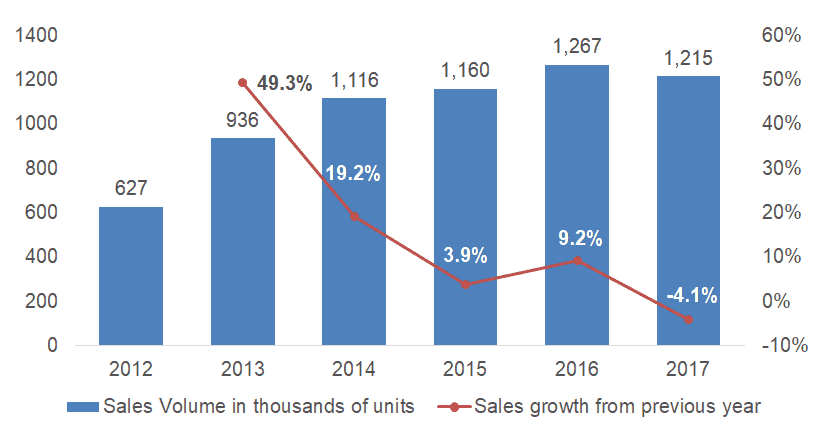
Ford sold 1.215 million vehicles in China in 2017. The company has increased its market share from 3.3% in 2012 to 4.6% in 2016. The company’s market share slightly decreased in 2017, but Ford is confident that its market share will continue to increase over the next few years for a few reasons.
Figure 2. Ford’s growth in China
First, Ford has formed strong partnerships with local Chinese automotive manufacturing companies. The company has 3 joint ventures in China:
- Changan Ford Automobile Corporation, Ltd. (CAF) — a 50/50 joint venture between Ford and Chongqing Changan Automobile Co., Ltd. CAF that operates 7 plants in China.
- Changan Ford Mazda Engine Company, Ltd. (CFME) — a joint venture between Ford and Mazda in China. Both companies have 25% stake in a joint venture with Changan who have a 50% stake. CFME produces engines for Ford and Mazda vehicles made in China.
- JMC – a joint venture between Ford and Jiangling Holdings, Ltd. JMC operates 3 assembly plants and one engine plant in China.
Local partnerships like these have helped Ford to grow in foreign markets much faster.
In addition to these local partnerships, Ford experiences significant success in China with its luxury Lincoln brand. According to the company’s financial report[1], sales of its luxury vehicles tripled in China in 2016. The Lincoln brand is recognized for its quality, style and customer satisfaction.
Few of Ford’s competitors have had such success in China.
4. Geographically diversified revenue streams
The majority of Ford’s revenue comes from the U.S., where the company sold 2.566 million vehicles units and earned US$93.844 billion or 59.9% of its total revenue in 2017.[1] Most automotive companies rely on their home markets to generate the majority of their sales, including Ford.
Figure 3. Ford’s largest markets by number of vehicles sold and revenue earned in 2017
| Country | Vehicles sold (000’s) | % share of total | Revenue (US$ billions) | % share of total |
|---|---|---|---|---|
| United States | 2,566 | 38.8 | 93.844 | 59.9 |
| United Kingdom | 418 | 6.3 | 9.619 | 6.1 |
| Canada | 308 | 4.7 | 10.580 | 6.7 |
| Germany | 277 | 4.2 | 7.265 | 4.6 |
| Other | 3,038 | 46 | 35.468 | 22.6 |
| Total | 6,607 | 100 | 156.776 | 100 |
Source: Ford’s financial report[1]
However outside of its home market, Ford has a more diversified revenue stream than its rivals. Overall, Ford receives 72.7% of its revenue from 3 different markets. In comparison, General Motors earns 76.4% from the U.S. alone, while Toyota relies on 3 big markets to generate over 75% of its revenue. Ford’s competitors therefore rely more heavily on only a few markets to generate the bulk of their revenues, making them more susceptible than Ford to political, economic, social and demographic changes in those markets.
Figure 4. Ford’s revenue breakdown by country
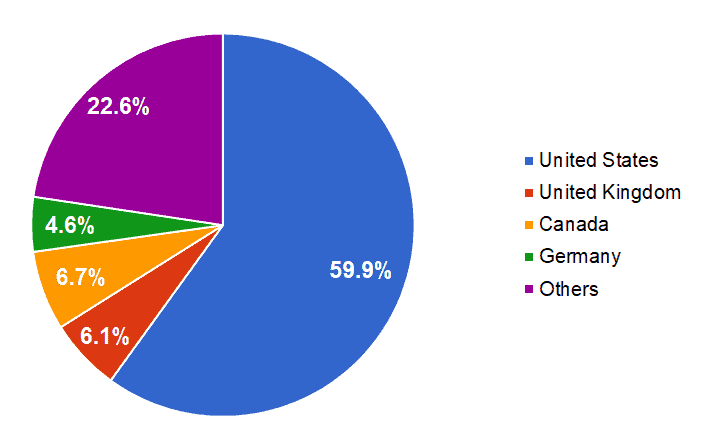
Source: Ford’s financial report[1]
Figure 5. Toyota Motor Corporation’s and General Motors’ revenue breakdown by country
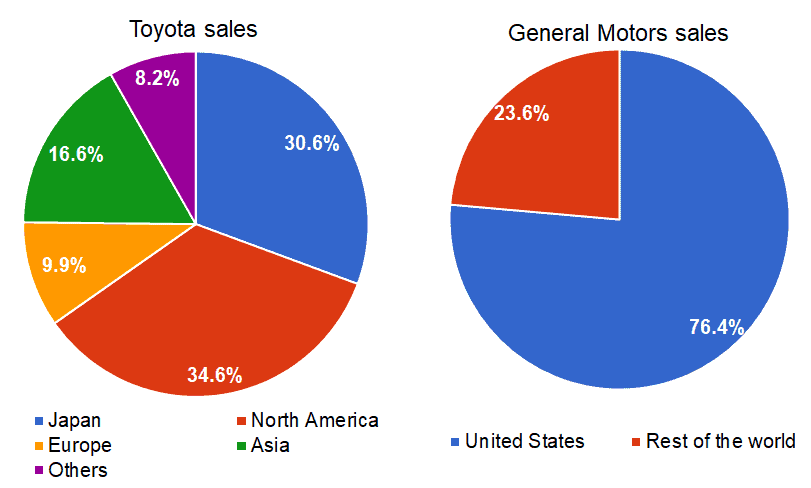
Source: The respective companies’ financial reports[8][9]
5. Research and development spending combined with a clear future strategy
Ford has identified innovation as being the key driver of the company’s growth into the technological future. When unveiling the “Ford Smart Mobility” plan in January 2015, President and CEO Mark Fields stated that “We are driving innovation in every part of our business to be both a product and mobility company – and, ultimately, to change the way the world moves just as our founder Henry Ford did 111 years ago.”[14] Key components of the plan are a focus on car connectivity, mobility, autonomous self-driving vehicles, the customer experience and big data.
In 2016, Ford’s patent applications reflected this innovation focus, increasing in number by 40% over the previous year. Applications were filed for more than 8000 inventions, including autonomous and connected vehicles, drones, robots, navigation and ride-sharing platforms.[15] Ford was granted approximately 3200 patents in 2016 – 1,500 in the U.S. and another 1,700 in other countries. None of Ford’s competitors were able to match tem in terms of the number of filed applications or the number of granted patents.
It is clear that Ford recognizes technology as a key battleground for the automotive industry, both now and into the future. In the words of Ford’s Mark Fields “We want to disrupt like a startup”.
Figure 6. Comparison of R&D expenditure – Ford and selected major competitors (in US$ billions)
| Company | 2017 R&D | As a % of revenues | 2016 R&D | As a % of revenues | 2015 R&D | As a % of revenues |
|---|---|---|---|---|---|---|
| Ford | 8 | 5.1 | 7.3 | 4.8 | 6.7 | 4.5 |
| Toyota | 9.3 | 3.8 | 9.4 | 3.7 | 8.4 | 3.7 |
| Volkswagen | 15.8 | 6.7 | 14.4 | 7.3 | 14 | 7.4 |
| General Motors | 7.3 | 5 | 8.1 | 4.9 | 7.5 | 4.9 |
Source: The respective companies’ financial reports[1][8][9][10]
Ford’s increased focus on innovation and its growing R&D expenditure helps to prepare the company for the future and secure its growth.
Weaknesses
1. Weak brand portfolio
Ford currently sells the majority of its vehicles under its own ‘Ford’ brand, with top-end luxury cars being sold under its Lincoln brand.[1] By comparison, some of its major competitors have a much larger brand portfolio, as illustrated below.
Figure 7. Brand portfolio of selected major Ford competitors
| Company | Brand portfolio |
|---|---|
| Ford | Ford, Lincoln |
| Toyota | Toyota, Lexus, Daihatsu, Hino |
| General Motors | Holden, Buick, Cadillac, Chevrolet, GMC, Opel, Vauxhall, Alpheon, Baojun, Jiefang and Wuling. |
| Volkswagen | Volkswagen, Audi, SEAT, Škoda, Bentley, Bugatti, Lamborghini, Porsche, Ducati, Volkswagen Commercial Vehicles, Scania, Man. |
| Chrysler | Chrysler, Alfa Romeo, Abarth, Dodge, Fiat, Jeep, Lancia, Ram |
Source: The respective companies’ financial reports[1][8][9][10][11]
While Ford’s branding strategy would likely assist with brand awareness and recognition, there are several potential disadvantages to this approach. Ford’s competitors with brand diversification (i.e. multiple brands) can more easily create a hierarchy for their vehicles in consumers’ minds, facilitating product differentiation. A brand diversification strategy can also minimize the fallout from any controversies that a vehicle manufacturer may experience.
However, a company like Ford with their minimalist branding strategy is unlikely to be able to negate the negative publicity associated with product recalls, advertising scandals or vehicle failures. As recently as 2017, Ford faced a public backlash in South Africa after they recalled all 2014 Ford Kuga models because some were spontaneously catching on fire.[12] The company generally suffers from high recall rates and low rankings in vehicle dependability studies.
Similarly, having such a minimalist branding strategy ensures that product recalls of Ford vehicles inevitably prominently feature the Ford brand in any media coverage, damaging the brand image in consumers’ minds.
2. Declining market share in the U.S. automotive market
At the turn of the century, the “big three” U.S. automotive companies (General Motors, Ford and Chrysler) sold more than two-thirds[13] of all vehicles in the U.S. market, today that figure is approximately 44%. Over the past few years, Chrysler has managed to increase its U.S. market share. At the same time, Ford has lost the market share in the U.S. to Nissan and Honda.
Figure 8. U.S. vehicle market share – Ford and selected major competitors (vehicle units in thousands)
| 2017 | 2016 | 2015 | ||||
| Company | Vehicles | Market Share % | Vehicles | Market Share % | Vehicles | Market Share % |
| Ford | 2,575 | 14.9 | 2,599 | 14.8 | 2,603 | 14.9 |
| General Motors | 3,002 | 17.4 | 3,043 | 17.3 | 3,082 | 17.6 |
| Toyota | 2,435 | 14.1 | 2,450 | 14.0 | 2,499 | 14.3 |
| Chrysler | 2,073 | 12.0 | 2,244 | 12.8 | 2,244 | 12.9 |
Source: Good Car Bad Car[30][32][33]
The U.S. is Ford’s largest automotive market and is also the most profitable. As previously explained, the company has strong market share in pickup trucks, but it is losing market share in the SUV and compact car segments.
Most importantly, its declining market share in the U.S. signals that Ford is losing its competitive position. Regaining it will require time and huge investments.
3. Profitability of smaller vehicle models in its product range
The smaller vehicles in Ford’s range aren’t as profitable as its medium to large vehicles.[1] Ford is currently attempting to increase its market share in many newly developed and emerging international markets, such as the so called “BRIC” economies” (i.e. Brazil, Russia, India and China). However, the largest segments in these markets are for smaller vehicles. An initial side-effect of efforts to increase sales in these emerging markets may be a drop in Ford’s profitability per sale, a fact acknowledged in Ford’s 2017 Annual Report.[1] Longer term, this may be able to be addressed via shifting production facilities or aspects of vehicle production and the supply chain to more cost-effective regions.
4. Below average vehicle recall and dependability rates
In 2016, a study from iSeeCars[16] revealed how often different auto manufacturers had recalled their vehicles for fixes over the last 31 years. The industry’s average recall rate was 1,115 vehicles recalled per 1000 vehicles sold. This means that an average auto manufacturer recalled their vehicles multiple times until problems were properly fixed. Out of 18 auto manufacturers on this list, Ford ranked 12th with a recall rate of 1,139/1000 vehicles. Ford ranked below other mainstream auto manufacturers, such as Kia, Mazda, General Motors, Toyota and Nissan.
Figure 9. Recall Rates by Manufacturer 1985-2016
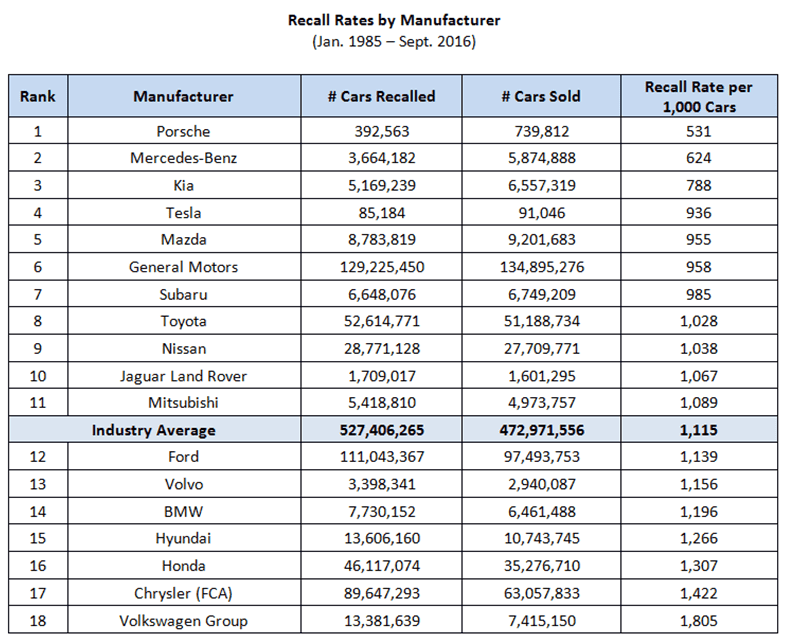
Source: iSeeCars.com[16]
Another study from J.D. Power[17] revealed the reliability of different vehicle brands . All the vehicles included in the study were 3-years-old. On average, vehicles had 142 problems per 100 vehicles, while Ford averaged 152 problems per 100 vehicles. The company ranked 16th on the list out of 31 brands. While this was an improvement over the previous year when Ford 26th on the list, this still damages company’s brand.
Both studies reveal comparative auto manufacturer vehicle quality statistics and Ford does not shine in either of them. Customers who buy brand new cars expect a quality product, but often get frustrated over recalls or faulty vehicles. This damages brand reputation, customer loyalty, sales and adds to costs. Ford’s below average recall and dependability rates for its vehicles is a huge weakness.
Opportunities
1. Future markets for self-driving vehicles
The global demand for autonomous vehicles is growing fast, mainly due to the need to improve road safety, ease the driving experience and minimize traffic congestion in big cities. There are five main levels of vehicle automation:
Figure 10. Levels of automation in vehicles
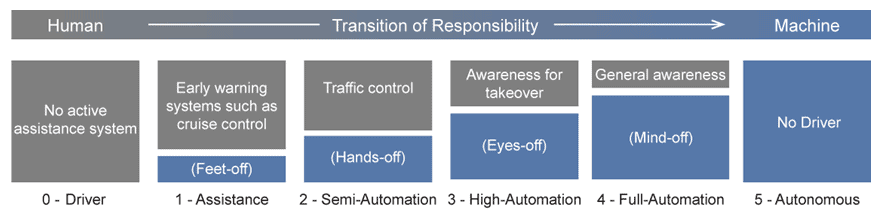
Source: BMW Financial Report[18]
At the moment, companies offer only level 2 automation vehicles for general consumers. According to Markets & Markets research[19], auto manufacturers produced only 2.73 million of these vehicles in 2016. Other research from Grand View Research reports that fully autonomous vehicles will be introduced to the market at a significant scale only in 2021-2022.[20]
In 2017, there were 44 companies working on autonomous vehicles, including Ford.[21] Ford was one of the first auto manufacturers to engage in developing a fully automated vehicle. The company expects to introduce a level 4 autonomous vehicle by 2021.[1]
The company has made progress toward this objective with its new-generation Fusion Hybrid autonomous development vehicle. In 2017, Ford was testing a fleet of 100 of these vehicles.[1]
Even though the potential opportunity for autonomous vehicles is huge, there are still many challenges. It is yet to be determined what the potential market size would be, how effective the vehicles are, costs, and how they will be regulated in terms of safety concerns. For example, currently only 33 states in America permit driverless cars on the roads.[22] However, in terms of innovation and potential, the market for self-driving cars could potentially be very lucrative. It is an opportunity that automotive companies have no choice but to explore in the current competitive technological environment.
2. Significant untapped potential of Chinese, Indian and other Asian international markets
Along with many global automotive companies, Ford has been capitalizing on China’s double digit economic growth for much of the past decade. Although this economic growth is slowing[23], China still represents a country of tremendous opportunity for automotive manufacturers, including Ford. China’s middle class is growing on the back of its economic growth, and demand for motor vehicles is increasing accordingly.[24] The Chinese motor vehicle industry is currently the largest in the world. Ford however only has a 4.2% market share in it.[1] In addition, Ford’s sales have recently slowed by comparison with those of its rivals Toyota and Honda in China.[25]
Ford’s strategy to increase market share in China is to focus on introducing more hybrid and electric vehicles to comply with strict Chinese quotas over production and sales for new energy vehicles. Between now and 2025, Ford expects to introduce 50 new vehicles, including 15 all-electric cars in China.[26]
With its strong brand reputation and increasing focus on research and development, Ford is well-positioned to capitalize on this opportunity.
In India, Ford similarly has a minimal market share of just 2.2%. However the market is forecast to be the world’s third largest by 2020 behind China and the United States, on the back of a rising middle class population, many of whom will be able to afford cars for the first time.[27] Ford views India as a growth market, and in 2017 increased its production capacity in India.[1]
By 2030, Asia’s share of the world’s middle class population is predicted to double, from 30% to 60%. Much of this growth will be in China and India, but also in Indonesia, Vietnam, Thailand and Malaysia. In many of these countries, the average number of cars per household is well below the levels in Western countries.[28] These countries represent a significant opportunity for all automotive companies, including Ford who has a physical presence in each of these markets.
3. Improving U.S. economic conditions
Vehicle sales figures indicate that buyers are favoring larger and more expensive vehicles. Larger vehicles are more profitable for Ford to produce than smaller, cheaper cars. Sales have been particularly strong in the pickup trucks segment of the market, which is traditionally dominated by Ford. The outlook for the U.S. economy is positive[29], which is an opportunity for Ford to consolidate and increase its already significant market share. Ford currently has the 2nd largest market share in the U.S.
Figure 11. Market share of major competitors in the U.S. market
| Company | Market share (%) |
|---|---|
| General Motors | 17.41 |
| Ford Motor Company | 14.94 |
| Toyota Motor Corporation | 14.12 |
| FCA/Chrysler Group | 12.02 |
| Nissan Motor Company | 9.84 |
| Honda Motor Company | 9.52 |
| Others | 22.15 |
Source: Good Car Bad Car [33]
4. Timing and frequency of new model releases
The market share of automotive companies is significantly impacted by the timing and frequency of new model releases, a fact that Ford itself acknowledges.[1] In 2017, the latest models of its popular F-Series pickup trucks were released, and sales volumes and revenue typically increase in such years. Historically, new models have tended to have major upgrades every 4 or 5 years, with only minor modifications in between.
However, due to rising consumer expectations in relation to in-car technology and the competitive nature of the industry, there is an argument to release upgraded models more frequently. Ford is well-positioned to be able to do this, with its current focus on R&D. The key will be its ability to cost effectively implement technology initiatives in order to maximize competitive advantage.
Threats
1. Increased competition
The automotive industry is highly competitive, both in the domestic U.S. market and in international markets around the world. Ford’s international rivals such as Toyota, Honda, Nissan and Hyundai have all aggressively taken market share from the traditional “big three” U.S. automotive companies (General Motors, Ford and Chrysler) since the turn of the century. This competition may further increase with the potential future entry of Chinese and Indian rivals.
In international markets, particularly in growth regions such as China, there is a similar intensity of competition. This competition is fueled by the fact that global automotive production capacity far exceeds demand. In 2017, there was an estimated global excess production capacity of 35 million units.[1]
In addition to traditional automotive competitors, technology companies such as Google and Apple are showing interest in the automotive market, through initiatives such as the development of driverless vehicles and sophisticated in-car technology that is compatible with their devices and operating platforms.[31] This may give these organizations technological influence over future vehicle development, which automotive companies may not be able to control.
2. Increasing government regulations
Many governments around the world are committed to reducing greenhouse gas emissions and are encouraging fuel efficiency initiatives. There is always a risk that such environmental initiatives may increase production costs for car manufacturers such as Ford, and that these costs won’t be able to be recouped in such a highly competitive, price-sensitive market. Although Ford has been relatively prominent in environmentally friendly hybrid and plug-in vehicle development, the demand for such vehicles is still very small.
3. Potential economic and political volatility in international markets
With Ford currently generating 40.1% of its total revenue from outside of its home U.S. market (refer back to Figure 4), the company is vulnerable to international economic and political conditions. Stricter local government regulations and/or import controls, rising interest rates as well as the outbreak of hostilities or acts of terrorism could all adversely affect Ford’s operations internationally, particularly in Europe. Ford acknowledges this risk in its most recent financial report:
“The worldwide automotive industry is affected significantly by general economic conditions over which we have little control. Vehicles are durable goods, and consumers have latitude in determining whether and when to replace an existing vehicle. The decision whether to purchase a vehicle may be affected significantly by slowing economic growth, geopolitical events, and other factors (including the cost of purchasing and operating cars and trucks and the availability and cost of financing and fuel). As we have recently seen in the United States and Europe, in particular, the number of cars and trucks sold may vary substantially from year to year.”[1]
4. Rising fuel prices
Larger vehicles, which are Ford’s most profitable product lines, invariably use more fuel than smaller models. This makes Ford vulnerable to any rise in fuel prices over the medium to long-term. Consumers in such an environment may opt for smaller vehicles as a corresponding medium to long-term trend, adversely affecting Ford’s profitability if they are unable to improve the profitability of the small models in their product range.
Summary
Ford has one of the most iconic automotive brands in the world and it helped the company to grow in the past, but nowadays Ford has to rely on other strengths for successful growth.
The key areas Ford should focus on are its F-Series pickup trucks, China’s automotive market and research and development. F-Series pickup truck line is the best product the company has offered to the market to this day. Ford has to always strive to produce pickup trucks that are way more advanced and reliable than competition’s pickup trucks.
Ford should also step up its R&D spending and introduce more innovative products to the market. It’s the one area Ford is ahead of the competition at the moment. Innovative technologies and services that would enhance the driving experience would attract more tech savvy customers.
As for the weaknesses, Ford should focus on streamlining its operations to lower the price of its smaller range vehicles and also improve vehicle dependability and recall rates. Lower price and better quality vehicles would certainly help the company in Europe’s and China’s automotive markets.
Opportunities and threats present to Ford are the same as to other major automotive companies. The only way for Ford to get the most of these opportunities is to pursue them faster than rivals could. Threats are not posing immediate danger to the company and can be avoided in the future.
Ford will continue to grow in the near future if pickup truck sales will grow and the company will be able to eliminate some of the weaknesses.
Sources
- Ford Motor Company (2018). Form 10-K for the Fiscal Year Ended December 31st, 2017. Available at: http://shareholder.ford.com/~/media/Files/F/Ford-IR-V2/events-and-presentations/2018/F-2017-10-K-report.pdf Accessed June 5, 2018
- Cain, T. (2017). Top 11 Best-Selling Pickup Trucks In America – December 2017. Available at: http://www.goodcarbadcar.net/2018/01/top-11-best-selling-pickup-trucks-america-december-2017/ Accessed June 5, 2018
- Bunkley, N. (2015). The F-150, Ford’s heavy-duty profit hauler. Available at: http://www.autonews.com/article/20150428/BLOG06/150429797/the-f-150-fords-heavy-duty-profit-hauler Accessed June 5, 2018
- Woodyard, C. (2017). Many rich folks opt for plain ol’ pickups, economy cars. Available at: http://www.usatoday.com/story/money/cars/2017/02/20/many-rich-folks-opt-plain-ol-pickups-economy-cars/97978392/ Accessed June 5, 2018
- Interbrand (2018). Best Global Brands 2017. Available at: http://interbrand.com/best-brands/best-global-brands/2017/ranking/ Accessed June 5, 2018
- Forbes (2018). The World’s Most Valuable Brands. Available at: http://www.forbes.com/powerful-brands/list/ Accessed June 5, 2018
- IHS Markit (2018). General Motors Retains Leadership as Top Manufacturer in Automotive Loyalty Awards Presented by IHS Markit. Available at: http://news.ihsmarkit.com/press-release/automotive/general-motors-retains-leadership-top-manufacturer-automotive-loyalty-award Accessed June 5, 2018
- Toyota Motor Corporation (2017). Form 20-F for the Fiscal Year Ended March 31st, 2017. Available at: http://www.toyota-global.com/pages/contents/investors/ir_library/sec/pdf/20-F_201703_final.pdf Accessed June 5, 2018
- General Motors Company (2018). Form 10-K for the Fiscal Year Ended December 31st, 2017. Available at: http://www.gm.com/company/investors/sec-filings.html Accessed June 5, 2018
- Volkswagen AG (2018). Annual Report 2017. Available at: https://www.volkswagenag.com/presence/investorrelation/publications/annual-reports/2018/volkswagen/en/Y_2017_e.pdf Accessed June 5, 2018
- Fiat Chrysler Automobiles (2018). FCA Annual Report 2017. Available at: https://www.fcagroup.com/en-US/investors/financial_regulatory/financial_reports/files/FCA_NV_2017_Annual_Report.pdf Accessed June 5, 2018
- Chutel, L. (2017). It took 39 fires before Ford recalled exploding SUVs in South Africa. In the US, it took 0. Available at: https://qz.com/901046/ford-recalls-exploding-kuga-suv-in-south-africa/ Accessed June 5, 2018
- LeBeau, P. (2014). Big 3 Dominance Slipping as Competition Heats Up. Available at: http://www.cnbc.com/2014/12/18/big-3-dominance-slipping-as-competition-heats-up.html Accessed June 5, 2018
- Ford Motor Company (2015). Ford at CES Announces Smart Mobility Plan and 25 Global Experiments Designed to Change the Way the World Moves. Available at: https://media.ford.com/content/fordmedia/fna/us/en/news/2015/01/06/ford-at-ces-announces-smart-mobility-plan.html Accessed June 5, 2018
- Ford Motor Company (2016). Ford Tops Industry for U.S. Patents Granted in ; Employees Set New Record for Annual Number of Inventions. Available at: https://media.ford.com/content/fordmedia/fna/us/en/news/2016/12/09/ford-tops-industry-for-us-patents-granted-in-2016.html Accessed June 5, 2018
- Lee, T. (2016). Which Automakers Have the Best Recall Rate and Timeliness? Available at: http://blog.iseecars.com/2016/11/03/which-automaker-has-the-best-recall-rate-or-timeliness/ Accessed June 5, 2018
- J.D. Power (2018). Most Owners Still in Love with Their Three-Year-Old Vehicles, J.D. Power Finds. Available at: http://www.jdpower.com/press-releases/jd-power-2018-us-vehicle-dependability-study Accessed June 5, 2018
- BMW Group (2016). Annual Report 2016. Available at: https://www.bmwgroup.com/content/dam/bmw-group-websites/bmwgroup_com/ir/downloads/en/2015/12784_GB_2015_engl_Finanzbericht_Online.pdf Accessed June 5, 2018
- Research and Markets (2017). Global Autonomous Vehicles Market – Analysis & Forecast (2016-2025). Available at: http://www.researchandmarkets.com/research/wd2lrs/global_autonomous Accessed June 5, 2018
- Grand View Research (2017). Autonomous Cars/Driverless Cars Market Analysis And Segment Forecasts To 2024. Available at: http://www.grandviewresearch.com/industry-analysis/driverless-cars-market Accessed June 5, 2018
- CB Insights (2017). 44 Corporations Working On Autonomous Vehicles. Available at: https://www.cbinsights.com/blog/autonomous-driverless-vehicles-corporations-list/ Accessed June 5, 2018
- National Conference of State Legislature (2018). Autonomous Vehicles | Self-Driving Vehicles Enacted. Available at: http://www.ncsl.org/research/transportation/autonomous-vehicles-self-driving-vehicles-enacted-legislation.aspx Accessed June 5, 2018
- Trading Economics (2017). China GDP Annual Growth Rate. Available at: http://www.tradingeconomics.com/china/gdp-growth-annual Accessed June 5, 2018
- McCaffrey, C. R. and Peterson, E. R. (2018). The Rise of China’s Middle-Class Consumer. Available at: https://www.atkearney.com/diversity-and-inclusion/article/-/asset_publisher/O7EGSazwBWC9/content/the-rise-of-china-s-middle-class-consumer-article/236833 Accessed June 5, 2018
- Rosevear, J. (2017). Ford’s China Sales Get Help from a Brawny SUV. Available at: https://www.fool.com/investing/2017/03/07/fords-china-sales-get-help-from-a-brawny-suv.aspx Accessed June 5, 2018
- Shirouzu, N. and White, J.. (2017). Exclusive: One Ford, two systems – U.S. carmaker revamps China strategy amid EV push. Available at: https://www.reuters.com/article/us-fordmotor-china-strategy-exclusive/exclusive-one-ford-two-systems-u-s-carmaker-revamps-china-strategy-amid-ev-push-idUSKCN1C81EB Accessed June 5, 2018
- Karnik, M. (2016). 600 million people are now part of India’s middle class—including your local carpenter. Available at: https://qz.com/742986/600-million-people-are-now-part-of-indias-middle-class-including-your-local-carpenter/ Accessed June 5, 2018
- Roughneen, S. and Asia, N. (2017) Booming Southeast Asian vehicle sales drive urban congestion. Available at: https://www.ft.com/content/96608536-4204-11e7-9d56-25f963e998b2 Accessed June 5, 2018
- Trading Economics (2018). United States GDP Growth Rate. Available at: http://www.tradingeconomics.com/united-states/gdp-growth Accessed June 5, 2018
- Cain, T. (2016). U.S. Auto Sales Brand Rankings – 2015 Year End. Available at: http://www.goodcarbadcar.net/2017/01/usa-2016-auto-brand-sales-results-rankings.html Accessed June 5, 2018
- Greenough, J. (2017). How Tech Companies Will Win the Battle Over the Connected Car’s Digital Dashboard. Available at: http://www.businessinsider.com.au/how-tech-companies-will-win-the-battle-over-the-connected-cars-digital-dashboard-2015-12 Accessed June 5, 2018
- Cain, T. (2017). U.S. Auto Sales Brand Rankings – 2016 Year End. Available at: http://www.goodcarbadcar.net/2017/01/usa-2016-auto-brand-sales-results-rankings.html Accessed June 5, 2018
- Matthews, J. (2018). U.S. Auto Sales Brand Rankings – December 2017 YTD. Available at: http://www.goodcarbadcar.net/2018/01/u-s-auto-sales-brand-rankings-december-2017-ytd/ Accessed June 5, 2018